First, a quick recap
Before we unpack what’s new with Zscaler Digital Experience (ZDX), let’s quickly review how we got here.
Apps, data, and employees are distributed
Did you know that organizations with 250+ employees typically use more than 100 SaaS apps? And with workloads migrating to the cloud, by 2024, most enterprises aspire to have $8 out of every $10 for IT hosting go toward the cloud.
As apps and data disperse to the cloud, IT teams have added additional performance monitoring telemetry to their arsenal to gain visibility across all their assets on and off the cloud.
In the meantime, the workplace as we know it has changed. Today’s hybrid workforce relies on home Wi-Fi networks and local ISPs to directly access SaaS and cloud-based services. More than 63% of employees prefer hybrid or remote work.
Broad cloud adoption and hybrid workplaces have put pressure on network operations, service desk and security teams. They’ve seen a 35% increase in support ticket volumes and a rise of more than 30% in service cost per ticket.
Point monitoring tools leave IT teams poorly prepared
Device, network, and application monitoring tools leave blind spots between the user’s device and the app, and require IT operations and service desk teams to manually export and correlate data from each tool.
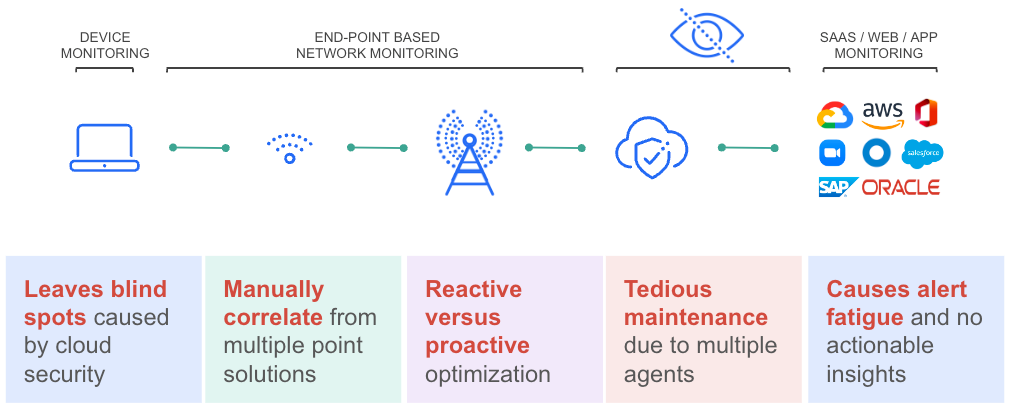
This lack of end-to-end visibility into digital experience forces IT teams into firefighting problems after they have been reported, versus proactively finding and fixing them. Additionally, each of these tools send numerous alerts that are often not actionable and frequently misguide teams when uncovering the root cause.
Zscaler Digital Experience (ZDX) unifies monitoring silos
As part of the Zscaler Zero Trust Exchange, ZDX helps IT teams monitor digital experiences from the end user perspective to optimize performance and rapidly fix offending application, network, and device issues.
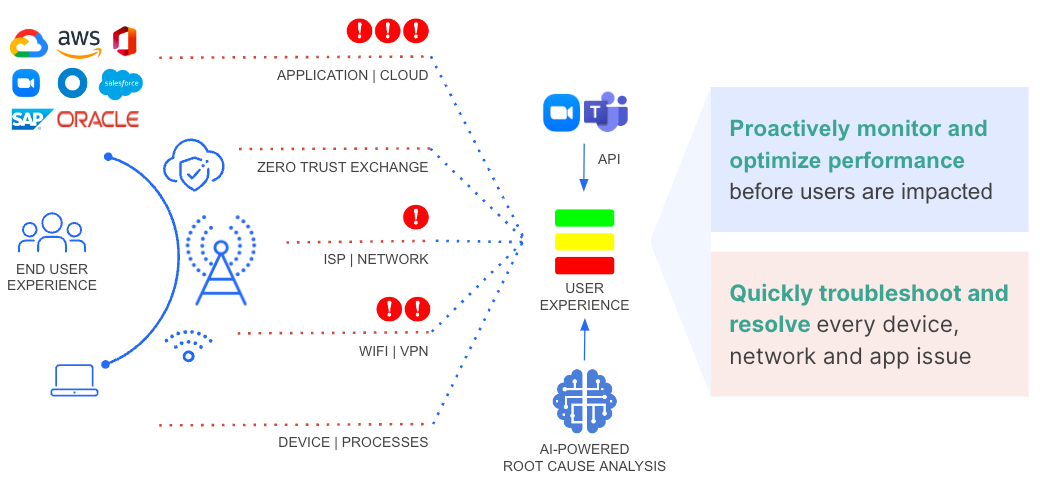
By securely monitoring your business’s SaaS, public cloud, and data center-based applications right from within your end user devices, Zscaler is able to present user experience insights across your organization, along with an end-to-end view on performance and availability across the entire application delivery chain. Armed with these insights:
- Network Operations teams can review digital experience health, detect bottlenecks across all their enterprise applications in real time, and rapidly resolve service degradation before users complain.
- Service desk teams have readily available root cause analysis for every user complaint, helping them quickly triage and efficiently resolve problems, and get employees back to work faster.
Unveiling new capabilities for Zscaler Digital Experience
As a product of continued efforts to empower network operations and service desk teams to deliver flawless digital experiences and support workforce productivity—especially within businesses where applications, data, and their users are widely distributed—we are delighted to announce the Industry’s Most Intelligent Digital Experience Monitoring solution that enables IT teams to amplify the impact of doing business anywhere. Let’s unpack the details.
Maximize digital dexterity a.k.a usage with global insights
Businesses thrive when employees fully and willingly use digital tools and data to collaborate and get work done efficiently. ZDX now gives you more insights to help ensure optimize performance of digital services and everything they rely on.
1. Monitor the quality of Webex meetings: Presently, you can use ZDX to monitor the quality of MS Teams and Zoom meetings to instantly isolate root causes of poor experiences, and thus ensure uninterrupted and productive meetings. With this release, we have extended these capabilities to Webex!

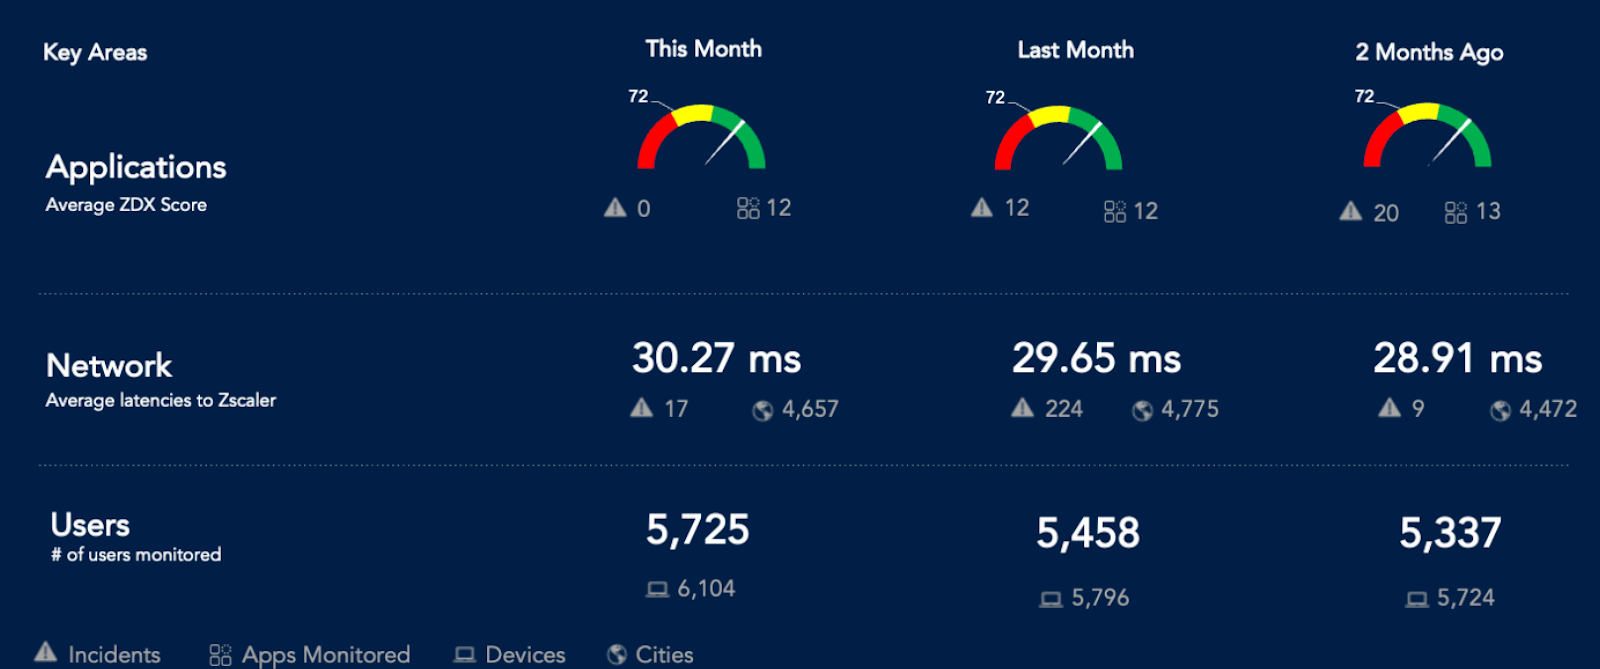
2. Get quarterly insights for productivity reviews: While insights that help us keep the lights on day-to-day are incredibly valuable, IT teams need to be able to review their impact periodically to celebrate successes and seek opportunities for optimization. With quarterly business review (QBR) reports, you can do just that, on a monthly or quarterly basis, and share your teams’ impact with all stakeholders.
Achieve faster IT resolutions using AI
Digital-first businesses, complex environments, and remote workers’ devices, when monitored for performance, generate vast amounts of data. With AI, this can produce valuable insights.
1. Automate root cause analysis: ZDX uses machine learning to accurately expose root cause by garnering information from past experiences, ensuring that IT addresses the core issues causing poor user experience, instead of just remedying the symptoms.
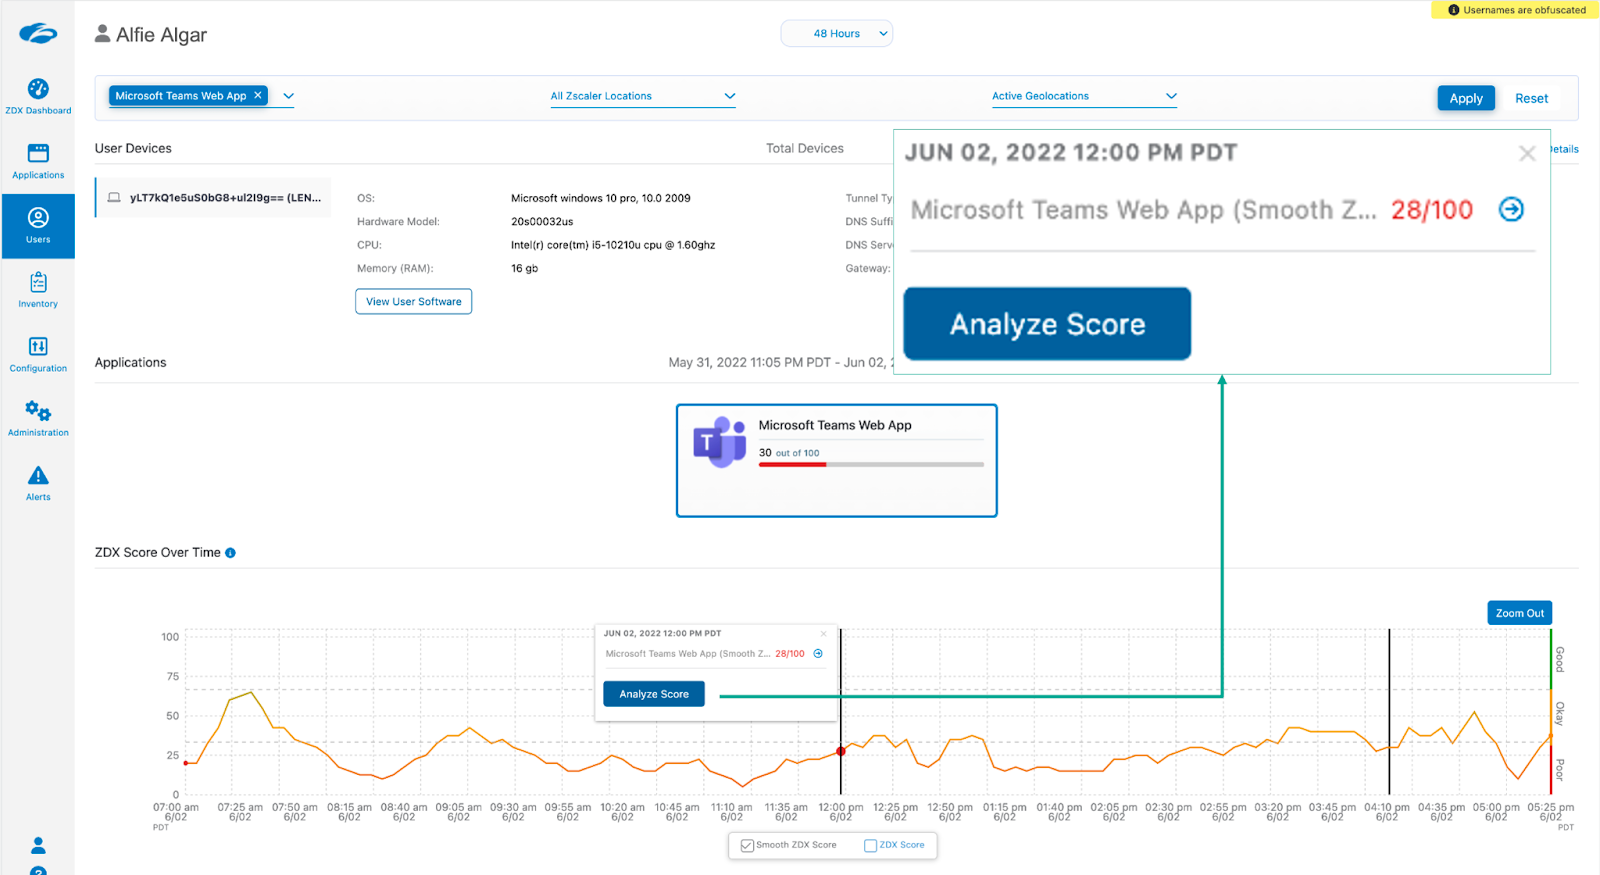
2. Perform AI-powered analysis: IT teams can also review what factors changed, between when user experience was optimal and when it was degraded, or a fixed point in time. 
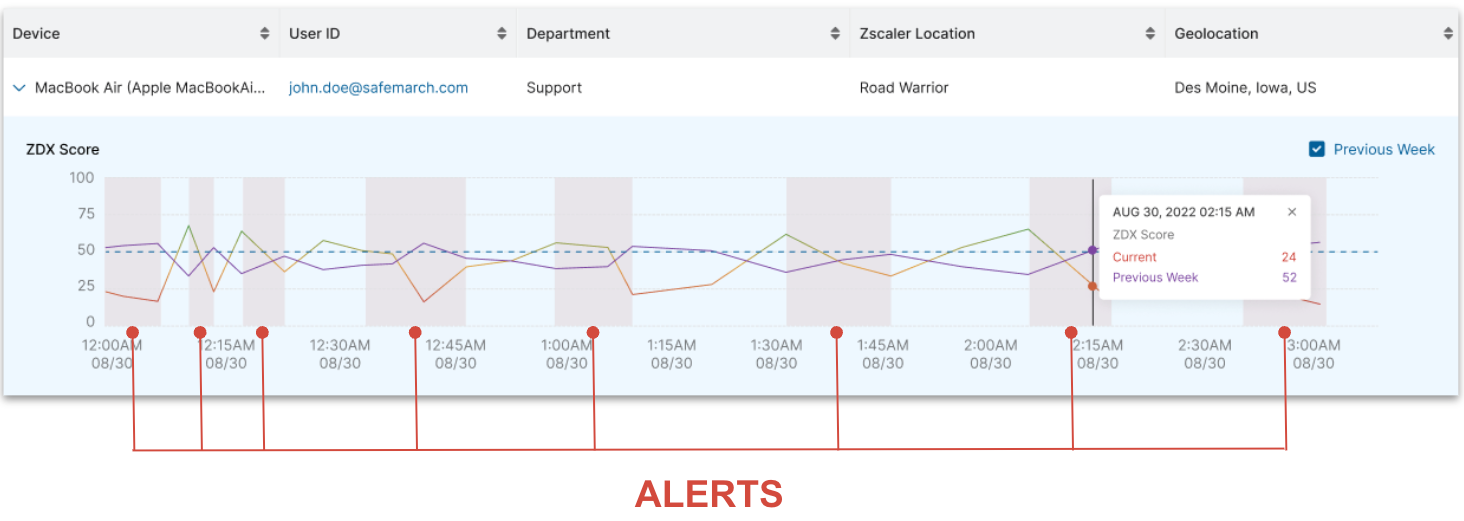
3. Automate alerts using built-in intelligence: With the multiple factors that can impact user experience, it is close to impossible to create alerts and set meaningful thresholds for every scenario. ZDX has greatly simplified alert configuration. By observing what “normal” looks like for specific users, regions, applications, devices, or networks, ZDX is automatically able to identify when anomalies occur and triggers precise alerts. No longer do admins need to routinely configure and maintain alerts.
Effortlessly scale global enterprises
A growing business is a healthy business. And they need to scale quickly. IT can help by quickly onboarding employees and ensure that they have great user experiences no matter their location, device, or the applications they rely on to be productive.
IT environments are complex. With this release, we introduce capabilities that help implement digital experience monitoring practices more broadly.
1. Get endpoint performance insights: Desktop support teams often struggle with resolving device issues for remote workers and employees in other regions. This release adds a range of key metrics including device health, active processes for ChromeOS and Android (Windows and MacOS are already supported), and Windows OS metrics drawn from Microsoft Intune that are critical to troubleshooting device issues.
|
Device health metrics CPU, memory, battery, disk I/O and usage, network I/O and bandwidth, Wi-Fi |
Process metrics Top processes and utilization across CPU, memory, disk I/O, network I/O |
Windows OS metrics Focus time, boot up time, crash reports, software events |
2. Capture packets remotely: With 80% of performance issues in hybrid workplaces being largely caused by network problems, this gives IT teams critical information to isolate and fix these issues.
3. Monitor private apps without causing denial of service: For applications protected by Zscaler Private Access (ZPA), this release introduces web caching within the app connector thereby reducing the load on applications without impacting monitoring fidelity.

4. Get end-to-end visibility when using third-party proxies: Adopting zero trust is a journey, one where firewalls, VPNs, and Zscaler ZIA/ZPA co-exist. Now, ZDX can provide you with end-to-end cloud path performance insights across these complex network architectures and help you expose root causes for latency with confidence.
See how you can use ZDX
With these new capabilities, ZDX presents an even more powerful digital experience monitoring solution that can help IT teams positively impact employee experience, morale, and productivity, and as a result, business performance.
To learn more about these innovations, watch our webinar, and read our technical deep dive, or request a demo!


