

As accessibility to applications, devices, and networks increases, so does productivity… and complexity. But with the right tools, you are better equipped to analyze data with context and quickly identify the root cause when problems arise.
The way forward is to leverage Artificial Intelligence (AI) and Machine Learning (ML) to aid in discovering potential solutions. Not only does it make analyzing data points faster, it can provide an immediate benefit.
Let’s take a look at a real-world example: the 2022 FIFA World Cup, and how it is leveraging ML in innovative ways. FIFA has 12 dedicated tracking cameras to monitor the ball with 29 different data points to keep track of players and determine if they are offside. All this data is fed into a system to help referees increase their accuracy on calling offside while reducing the time to replay and review footage (escalations).

Source: Mashable
Similarly, if service desk teams could resolve tickets faster using ML-based technologies, they could reduce the number of escalations and lower the mean time to resolution (MTTR). And as employees continue to leverage diverse environments, it keeps them productive.
An end user calls the service desk with a SaaS application issue
What happens when a user has an issue? Let’s take a look at an example. When an end user is experiencing trouble, it can come in many different forms. In this example, they are attempting to connect to a SaaS application, or Zoom, and cannot connect. The end user calls the help desk to create a trouble ticket, and support has to run through their runbook as they are unsure if it’s the device, network, or application. Hence, they end up escalating after collecting some additional pieces of information, which increases troubleshooting cycles. Overall, the end user must suffer until the service desk and network operations teams can identify and resolve the root cause.
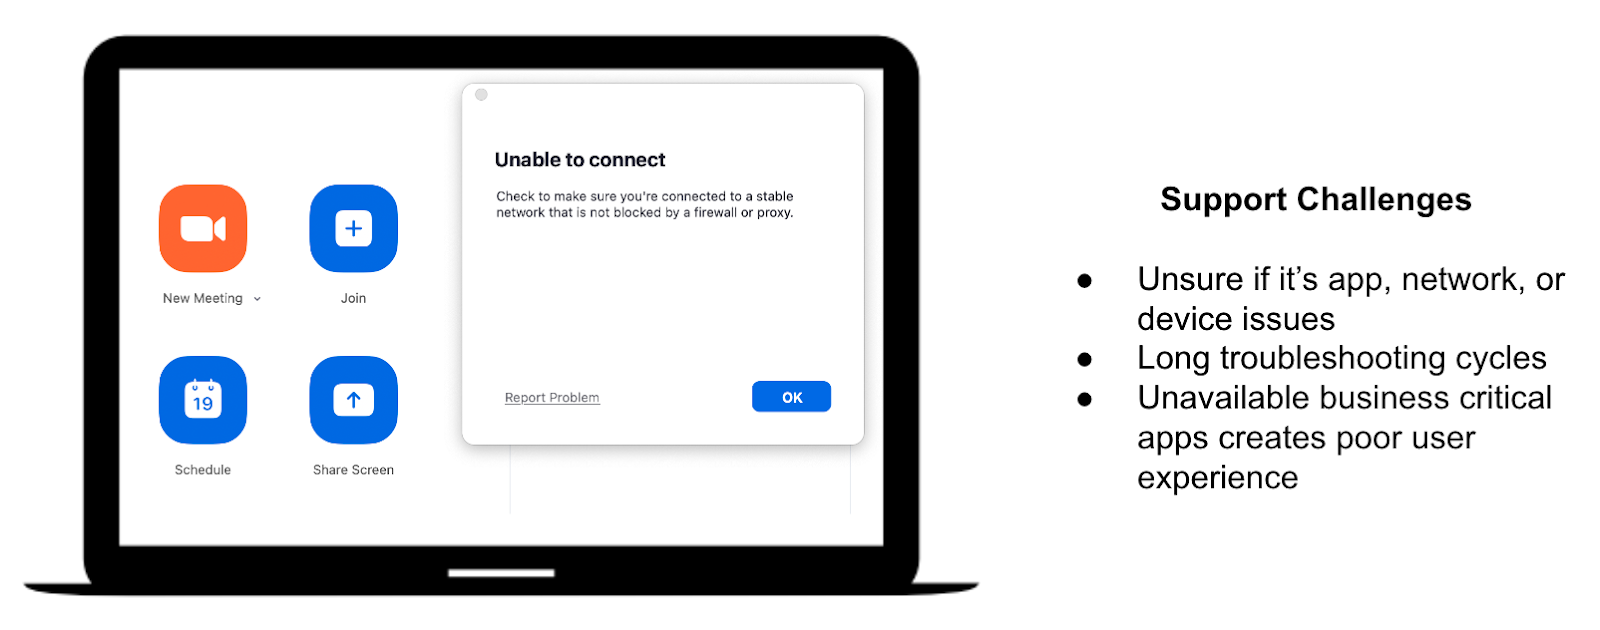
End user reports SaaS (Zoom) application issue
Challenges with troubleshooting end user issues
To find the root cause of the issue, service desk teams would have to analyze the entire path —from the end user to the application, and all the hops in between. Here is a list of all the areas IT teams typically have to manually sort through before declaring a resolution.
Potential problem areas:
- ISP issues
- Wi-Fi issues
- Application issues
- Connectivity issues, unstable connections
- Backhauling of traffic
- VPN latency
- High transit internet latency
- High egress latency
- Low region tenant score/geographical issue
- DNS issue
- High CPU, OS version change
- Direct latency higher than Zscaler latency
- Tunnel downgrades
Automatically analyze multiple data points and resolve issues faster
Now imagine feeding all these data points into an ML-based solution to provide insights into a potential root cause. It's similar to knowing if the player is offside using cameras and data points mentioned above at the FIFA World Cup.
The great news is that Zscaler's Digital Experience (ZDX) looks at all the data points on the list above to automatically isolate the root causes of performance issues. The advantage is to spend less time troubleshooting, eliminate finger-pointing, and get users back to work faster. ZDX AI-powered root cause analysis has three modes:
1. Single point in time mode: provides insights as to what’s going on with an end user’s experience in a matter of seconds.
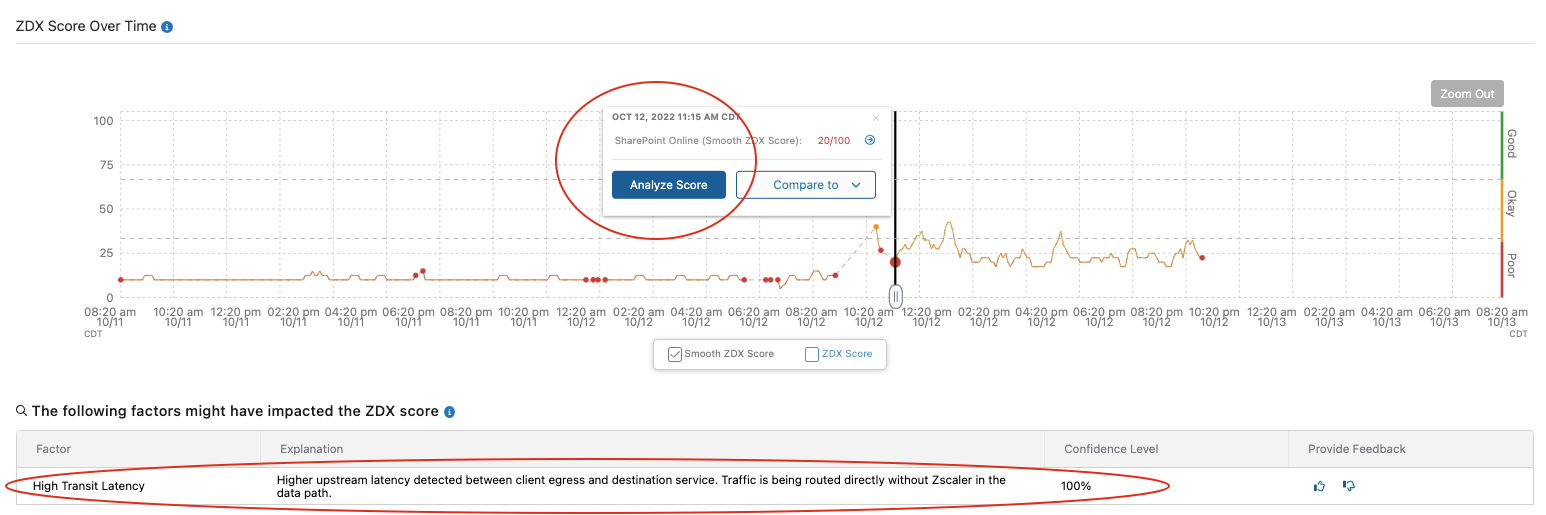
ZDX single point mode analysis
2. Time range mode: allows service desk teams to select a time range and get the two most common problems across the specified time range.
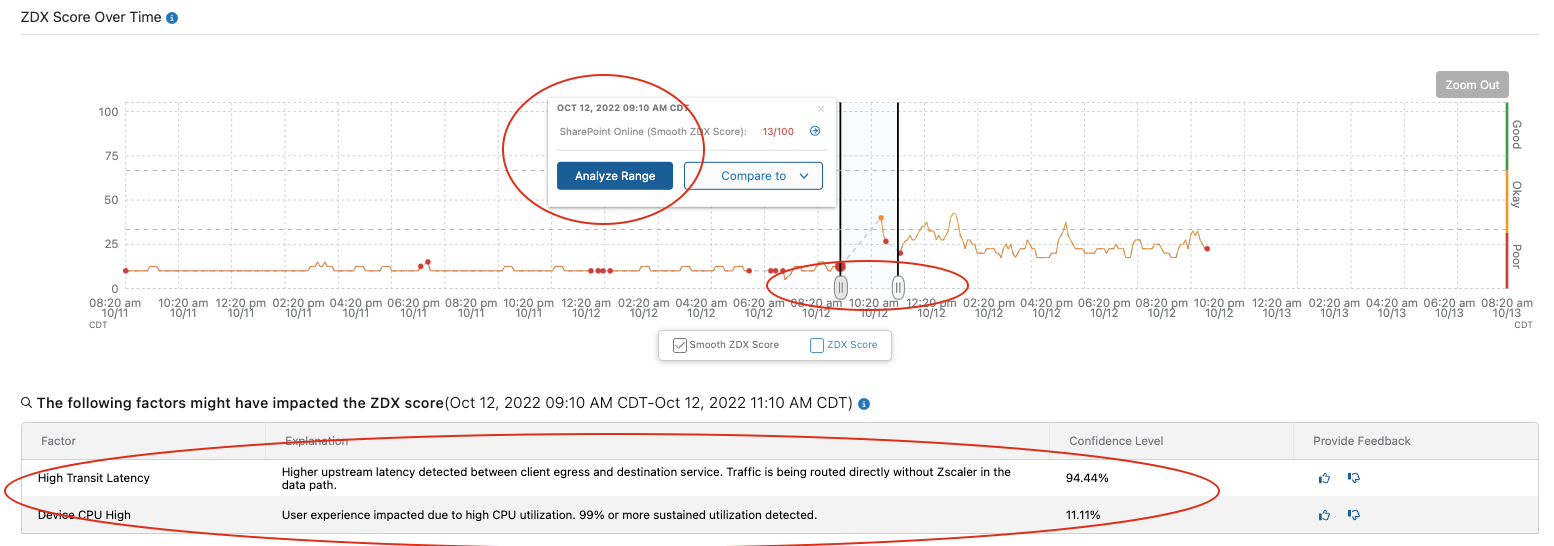
ZDX range mode analysis
3. Comparison across time mode: compares two points in time to understand the differences between the points. This function determines a good versus poor user experience. It visually highlights the differences between application, network, and device metrics.
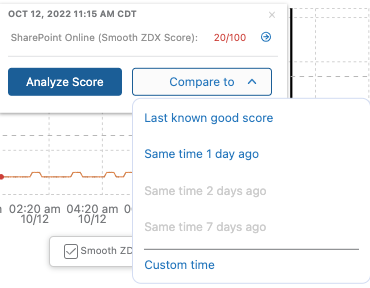
ZDX select two points in time to compare
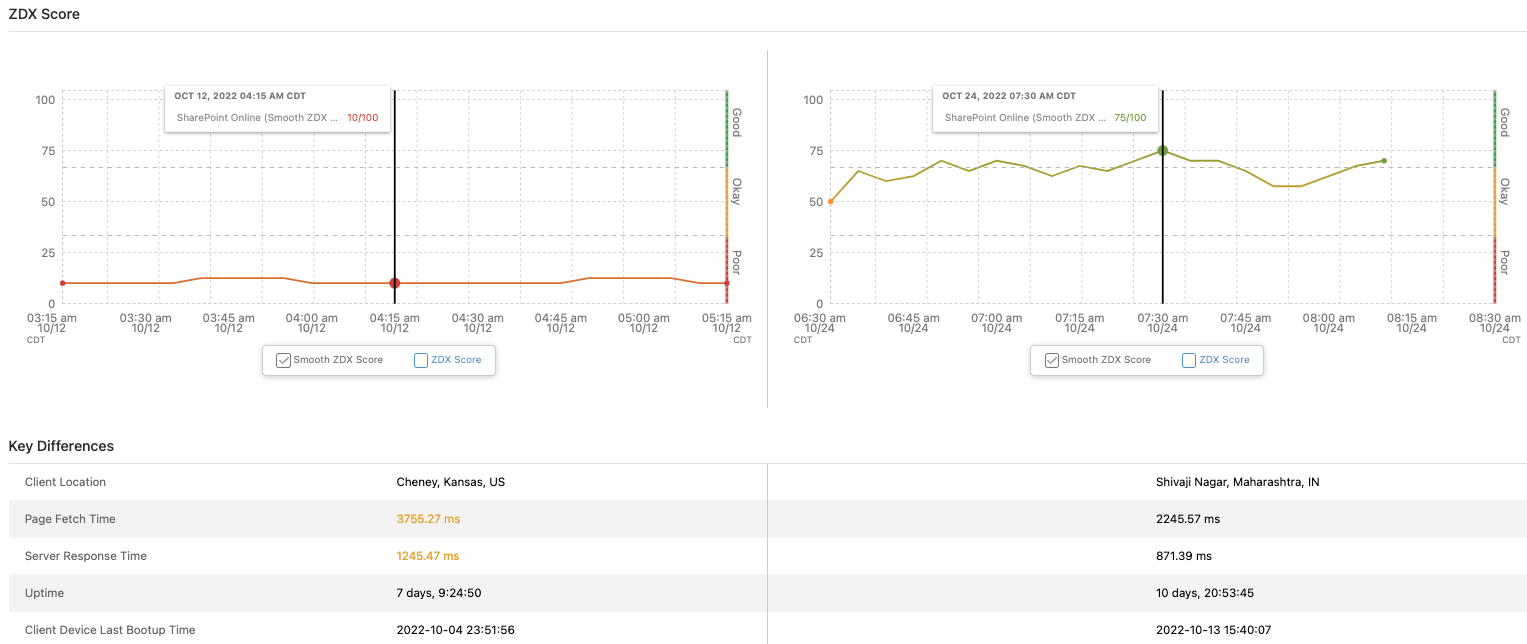
ZDX comparison mode analysis
ZDX AI-powered root cause analysis includes several modes to help analyze end users' performance issues, such as single point in time analysis, time range analysis, and comparison. Service desk and network operations teams are now empowered to understand the root cause of poor end user experience by applying ML-based solutions. To learn more about ZDX AI-powered root cause analysis watch this webinar!


