Zscaler Blog
Get the latest Zscaler blog updates in your inbox
What's New with Zscaler Digital Experience
Accelerate Troubleshooting and Improve Digital Experiences with New ZDX Capabilities!
In a world where user experience defines productivity, IT teams need more than just reactive monitoring — they need intelligence, automation, and precision. We’re excited to announce powerful new capabilities in Zscaler Digital Experience (ZDX):
• ZDX Network Intelligence — End-to-end network visibility
• Zscaler Managed Monitoring (multipath visualization) — Deep internet path insights
• Device Scoring & Remediation — Health monitoring and remediation for device issues at scale!
Together, these features empower IT and network teams to proactively detect, diagnose, and resolve issues faster than ever before to ensure their organizations can enjoy superior user experience while being protected by Zscaler’s industry leading Zero Trust platform.
Introducing ZDX Network Intelligence: End-to-End Visibility for Faster Troubleshooting
Gartner reports that 70% of organizations struggle with network complexity and lack of end-to-end visibility, hindering digital experience management. IDC estimates that unplanned IT downtime costs $250,000 per hour globally — a staggering reminder that reactive troubleshooting is no longer enough.
As enterprise traffic increasingly traverses public internet segments and zero trust overlays, traditional visibility tools fail to identify the true root causes of latency or packet loss. Network Ops and Service Desk teams face an uphill battle to pinpoint performance bottlenecks—whether it's from ISP, or intermediate carriers.
ZDX Network Intelligence changes that.
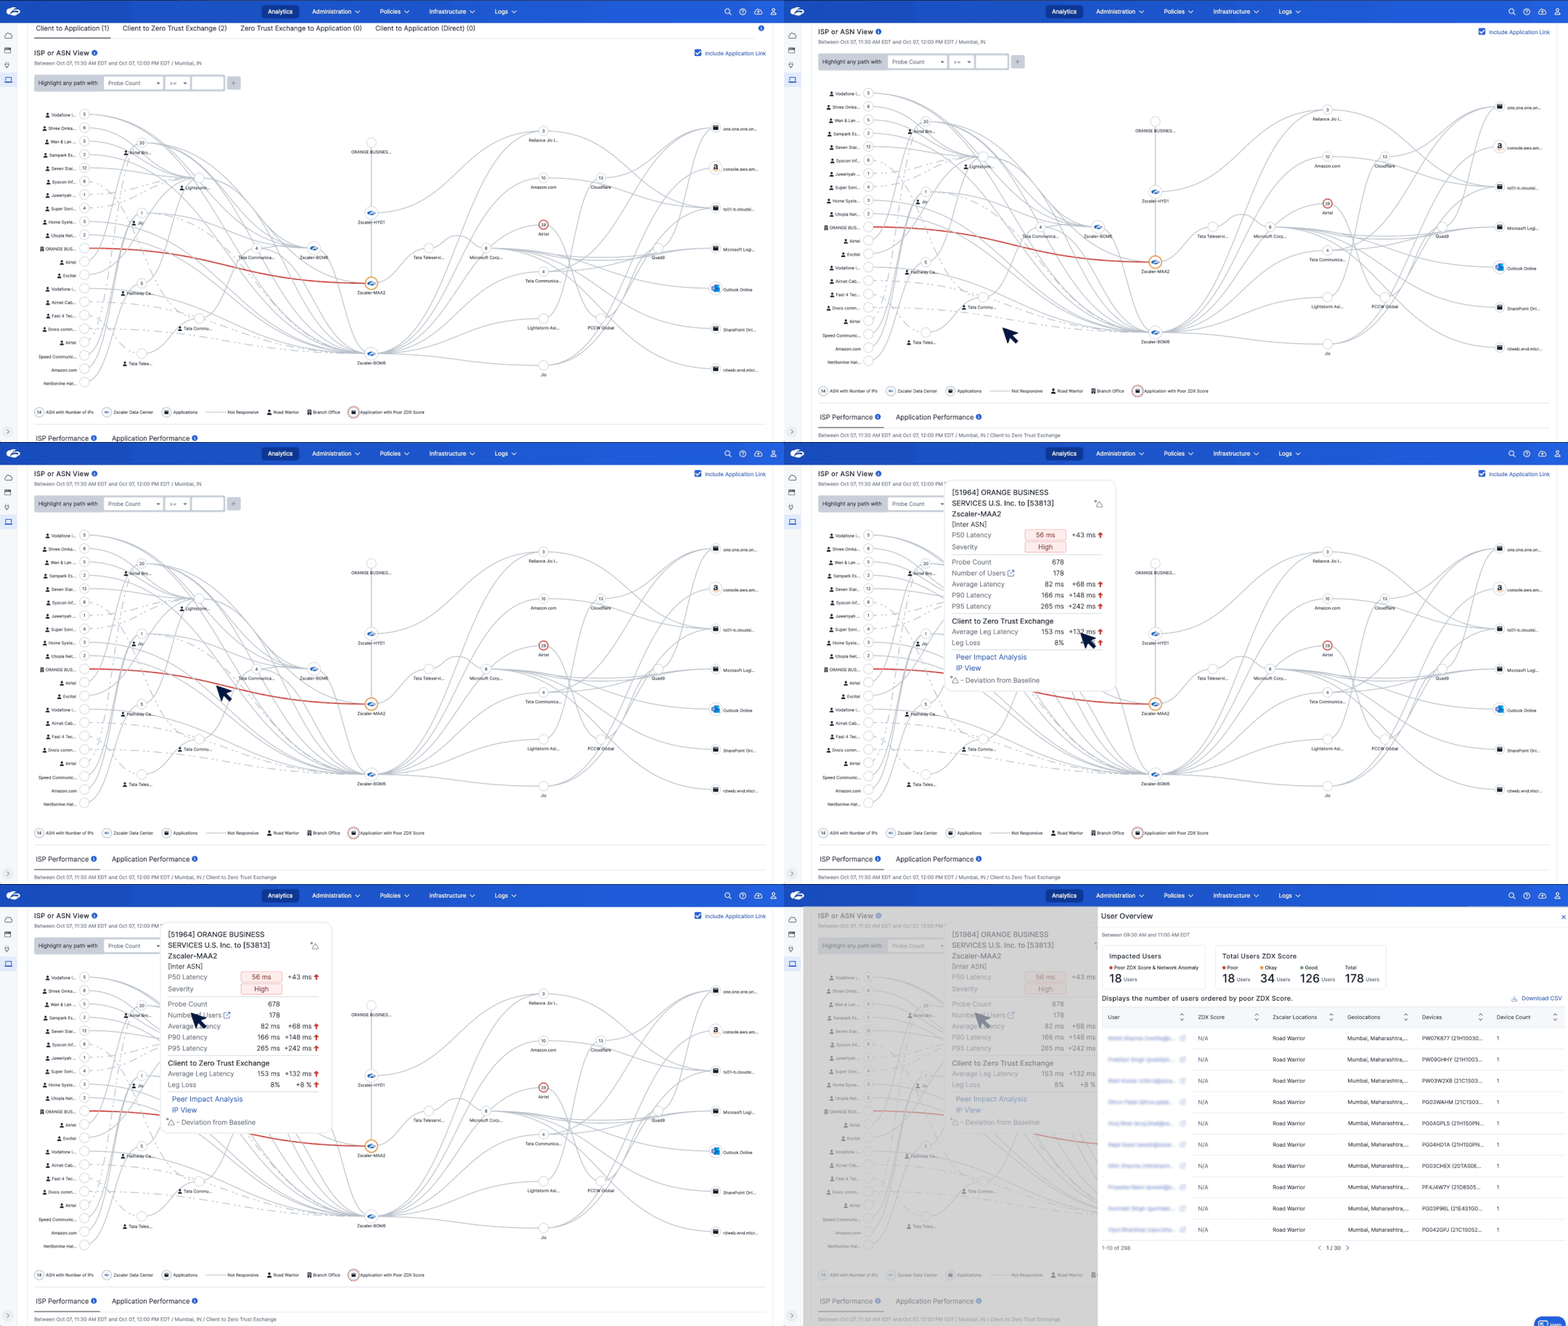
Every five minutes, Zscaler Client Connector launches lightweight cloud probes to collect telemetry — latency, packet loss, jitter — along the user’s exact route to the application. Through machine learning, these metrics are baselined and deviations are automatically flagged, giving teams real-time insights into which ISP is having performance issues and why performance degrades.
Aggregated views by Autonomous System Numbers (ASNs) allow teams to drill into specific intermediaries along traffic paths, and identify which geographic segments correspond to performance bottlenecks. This granular telemetry enables more targeted and efficient troubleshooting.
Key Capabilities: What You Gain with Network Intelligence
End-to-End Internet Visibility Beyond Perimeters
Modern networks extend beyond internal boundaries. Network Intelligence gives Network Ops teams visibility across the entire traffic path—covering last-mile ISPs, intermediate carriers, and Zscaler data centers—to detect where performance issues occur.

Network Intelligence provides your Network Ops teams a top down approach to drill down into anomalies and find the root cause of issues faster.
With every route color-coded by severity—red for critical, yellow for minor—Network Operations teams can instantly visualize problem areas, drill into specific geolocations, and correlate anomalies with user experience scores.

You can drill down from BGP AS (Border Gateway Protocol - Autonomous System) level of an ISP all the way down to the hops (routers) which are part of that AS and also see routers and links which are slowing the path down or adding a lot of latency.
Advanced Network Visibility and Peer Insights
Set custom alert thresholds and receive notifications when deviations from baselines occur. Whether it’s detecting an underperforming ISP or tracking a regional latency spike, these alerts allow teams to react with precision.
The Peer Impact Analysis feature provides visibility into whether there are other Zscaler customers impacted by the same anomaly. In the screenshot below we are showing that there are 3 other Zscaler customers going through that link also impacted.

Optimizing ISP and Data Center Paths
Don’t guess which ISPs perform best. By benchmarking and analyzing packet loss and latency across different ISPs, Network Intelligence highlights optimal routing paths. With this data the users can be switched to better-performing data centers (via configuration on the ZIA side) and teams can ensure seamless user experiences.

Device Scoring Remediation — From Insight to Action
For most IT teams, the phrase “my laptop is slow” triggers a familiar cycle — endless troubleshooting, vague user descriptions, and no objective way to know which devices truly need attention. Without a unified device health score that cuts across CPU load, memory pressure, disk latency, Wi-Fi quality, and crash frequency, support remains reactive, hardware refreshes become guesswork, and user productivity suffers.
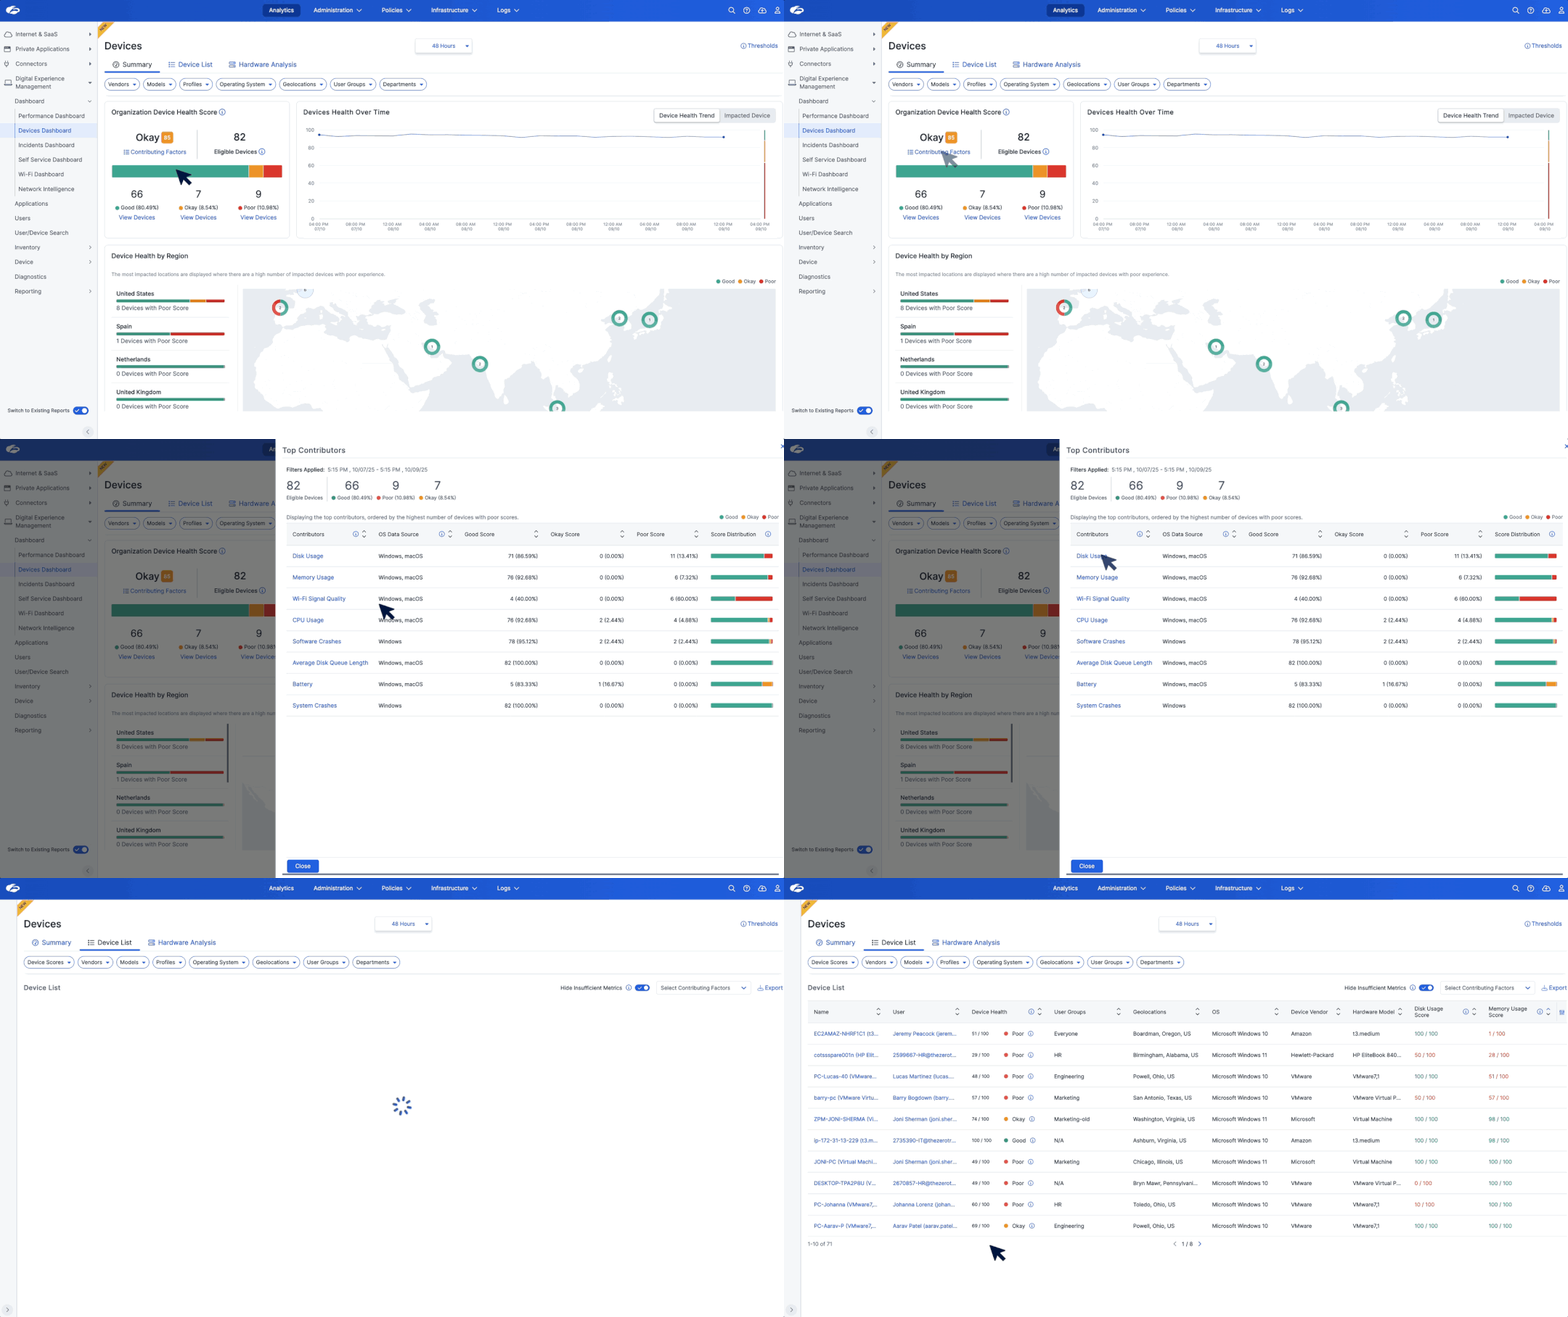
This is where Device Scoring comes in — ZDX’s data-driven way to grade every device in the organization and surface systems most likely to hurt user experience before help-desk tickets ever appear.
Device Scoring: Quantifying Device Health
Each laptop and desktop is continuously benchmarked against a balanced scorecard of hard and soft health indicators: sustained CPU utilization, memory peaks, disk I/O queues, Wi-Fi signal strength (2.4 GHz or 5 GHz), battery wear, blue-screens, and software crashes.
Instead of waiting for complaints, IT can instantly view “Bad” devices and fix the worst offenders — often through a driver update, disk cleanup, or memory upgrade.

Knowing that a device is unhealthy is only half the battle — fixing it efficiently, safely, and at scale is the real challenge.
Device Remediation: Fix at Scale
Until now, most L1/L2 teams relied on ad-hoc tools and one-off remote sessions just to perform basic actions like clearing caches, restarting services, or correcting misconfigurations. That changes with ZDX Device Remediation.
Device Remediation closes the last-mile gap by letting admins run vetted scripts and fixes across hundreds of devices with a single click — turning slow, manual repair work into a controlled, auditable, and scalable workflow.

The impact is immediate. Instead of 20 remote sessions, one click remediates 200 devices — before the first coffee refill.
Together, Device Scoring and Remediation transforms ZDX from a visibility platform into an active experience management system — one that not only detects when the device has performance issues but also has the capability to fix it!
Introducing Zscaler Managed Monitoring Multipath Support
Zscaler Managed Monitoring continuously tracks the availability and performance of SaaS and custom web applications from global Zscaler data center locations so customers can be alerted of issues before they impact their user experience and productivity. Zscaler Managed Monitoring’s new Multi-Path Visualization gives you a complete picture of how traffic actually travels across the internet. Instead of showing just one possible route like a traditional traceroute, it reveals all parallel paths created by load balancing, routing asymmetry, or ISP policies. This helps IT teams quickly see hidden bottlenecks, compare healthy vs. unhealthy routes, and prove exactly where performance issues originate.

Multi-Path Visualization aggregates traceroute on an IP-TTL combination over time, and visually overlays them in a unified view. With this, you can:
- Detect route flapping and transit inconsistencies
- Compare latency or loss across paths and hops
- Visualize transit ASNs, peering changes, and route shifts
Whether you’re debugging a slow SaaS app or validating your cloud routes, this view gives you clarity where raw traceroute logs fall short.
Multipath visualization shows all possible network paths traffic can take between a source and a destination. It captures multiple paths simultaneously, helping you identify routing asymmetry, load balancing, or ISP-level issues.
The Future of Experience Management
ZDX continues to evolve as the industry’s most comprehensive digital experience monitoring solution for Zscaler customers. With Network Intelligence, Multipath Visualization, Device Score and Remediation, enterprises can now:
Detect comprehensive device events like system and software crashes and internet-scale network anomalies
Diagnose end user performance issues at scale with AI-powered root cause across last-mile and intermediate ISP issues
Remediate enterprise-wide device issues remotely, while addressing persistent internet issues that impact end-to-end user experience
These innovations reinforce our mission: to deliver fast, reliable, and delightful digital experiences for every user, everywhere.
Take these features for a spin? Check out our interactive product tours!
Was this post useful?
Disclaimer: This blog post has been created by Zscaler for informational purposes only and is provided "as is" without any guarantees of accuracy, completeness or reliability. Zscaler assumes no responsibility for any errors or omissions or for any actions taken based on the information provided. Any third-party websites or resources linked in this blog post are provided for convenience only, and Zscaler is not responsible for their content or practices. All content is subject to change without notice. By accessing this blog, you agree to these terms and acknowledge your sole responsibility to verify and use the information as appropriate for your needs.
Get the latest Zscaler blog updates in your inbox
By submitting the form, you are agreeing to our privacy policy.


