On September 12, 2024, at 4:45 a.m. PDT, Zscaler Digital Experience (ZDX) detected a significant and sudden decline in the ZDX Score for Microsoft 365 services. Our analysis revealed elevated network latencies for Microsoft 365 services, indicating a Microsoft outage. The ZDX heatmap vividly showed the extent of the impact. This observation aligns with a Microsoft post on X.
ZDX found a Microsoft outage and its cause. This made our customers feel safe that the problem was in one place and on a certain network, which prevented big business disruptions and overwhelming IT teams.
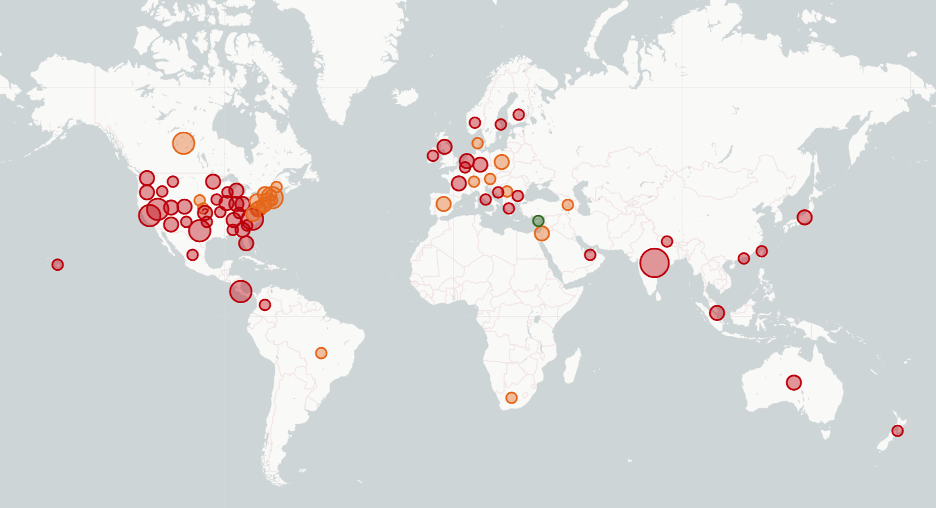
ZDX dashboard showing a Microsoft outage
ZDX enables customers to proactively identify and quickly isolate service issues, giving IT teams confidence in the root cause, reducing mean time to resolve (MTTR) and first response time (MTTD).
ZDX Score highlights Microsoft outage
Visible on the ZDX admin portal dashboard, the ZDX Score represents all users in an organization across all applications, locations, and cities on a scale of 0 to 100, with the low end indicating a poor user experience. Depending on the time and filters selected in the dashboard, the score will adjust accordingly.
The dashboard shows that the ZDX Score for the Microsoft probes dropped to Okay and Poor during the outage window of about one-and-half hours. From within ZDX, service desk teams can easily see that service isn't just bad for one place or user. They can quickly start looking into the cause of the problem.
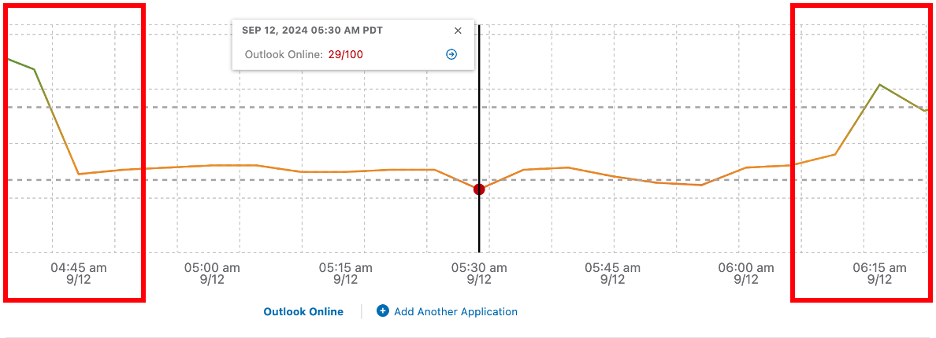
ZDX dashboard showing Microsoft issues
Also in the ZDX dashboard, “Web Probe Metrics” highlight the user impact of reaching Microsoft across a timeline with response times. In this case, the server responded with high page fetch times, showing there was an issue with Microsoft services.
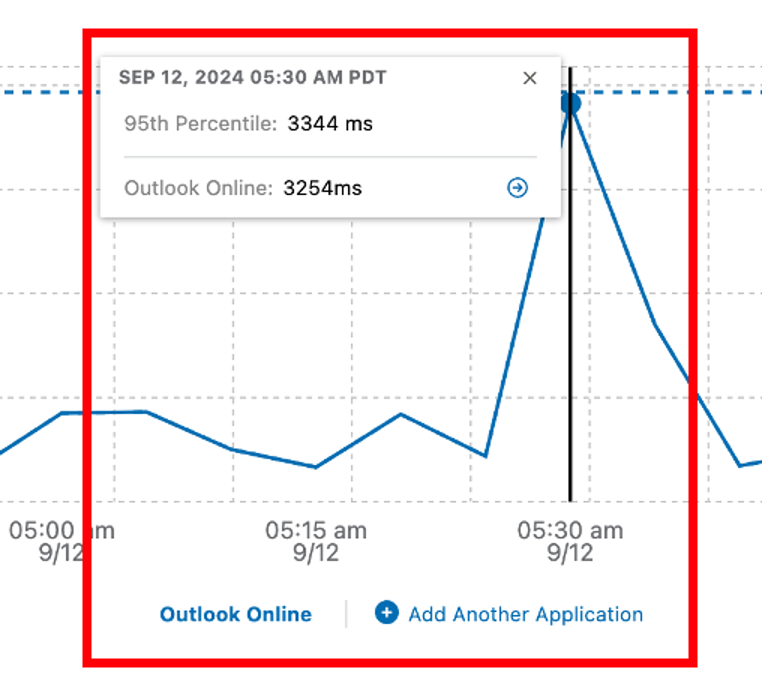
ZDX Web Probe Metrics showing high response times
ZDX can quickly identify the root cause of user experience issues with AI-powered root-cause analysis. This saves IT teams the time of looking through broken data and fixing problems. This helps speed up the solution and keep employees working.
With a simple click in the ZDX dashboard, you can analyze a score, and ZDX will provide insight into potential issues. In the case of this Microsoft outage, ZDX highlights that the network is impacted.

ZDX AI-powered root-cause analysis reveals the reason for the outage
It's clear that the network was the fundamental problem. The AI-powered root-cause analysis confirmed that the issue originated at the network level. IT teams can further confirm this by reviewing the Cloud Path metrics from the user to the destination.

ZDX Cloud Path showing full end-to-end data path
ZDX's AI-powered analysis and alerts help IT teams quickly tell the difference between good and bad user experiences. It does this by setting smart alerts for changes in performance metrics. ZDX lets IT teams compare metrics at different times to highlight issues quickly. It helps teams see the difference between good and bad user experiences by showing different things in application, network, and device metrics.
Microsoft posted a message on the X platform revealing an issue where users may be unable to access multiple Microsoft 365 services. This problem was resolved by 7:06 a.m. PDT, aligning with the ZDX data mentioned. Microsoft's services began to show signs of recovery shortly thereafter.
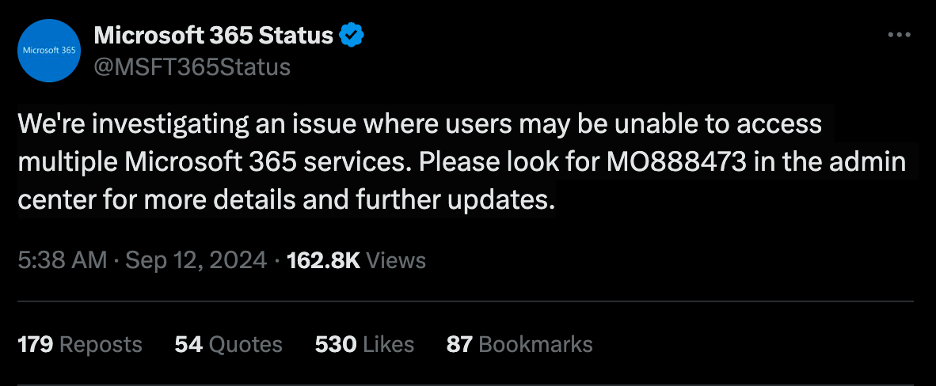
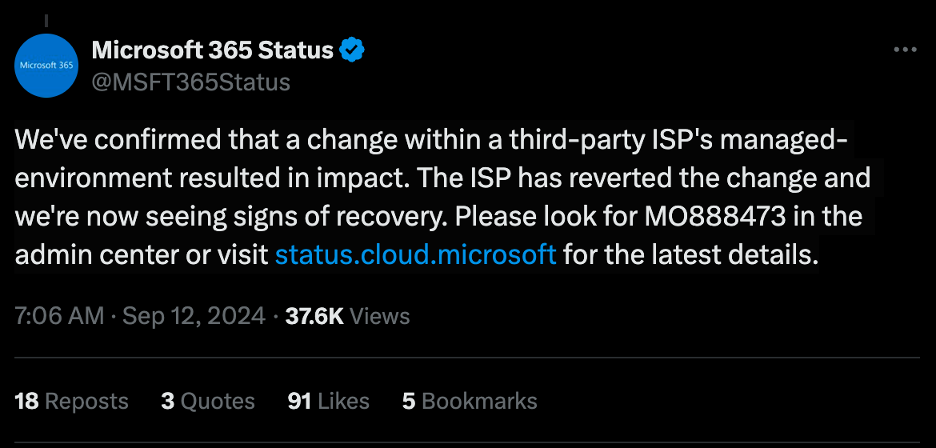
Source: Microsoft
ZDX alerting lets our customers know about problems before they happen. From a single dashboard, customers could quickly find the problem as a Microsoft issue instead of an internal network outage. This saves valuable IT resources.
Try Zscaler Digital Experience today
ZDX lets IT teams view digital experiences from the user's point of view. This improves performance and quickly solves problems with applications, networks, and devices.
Get in touch with us to discover how ZDX can benefit your organization.


