Zscaler Blog
Get the latest Zscaler blog updates in your inbox
LinkedIn Outage Detected by Zscaler Digital Experience (ZDX)

At 3:40 p.m. EST on March 6, 2024, Zscaler Digital Experience (ZDX) saw a substantial, unexpected drop in the ZDX score for LinkedIn services around the globe. Upon analysis, we noticed HTTP 503 errors highlighting a LinkedIn outage, with the ZDX heatmap clearly detailing the impact at a global scale.
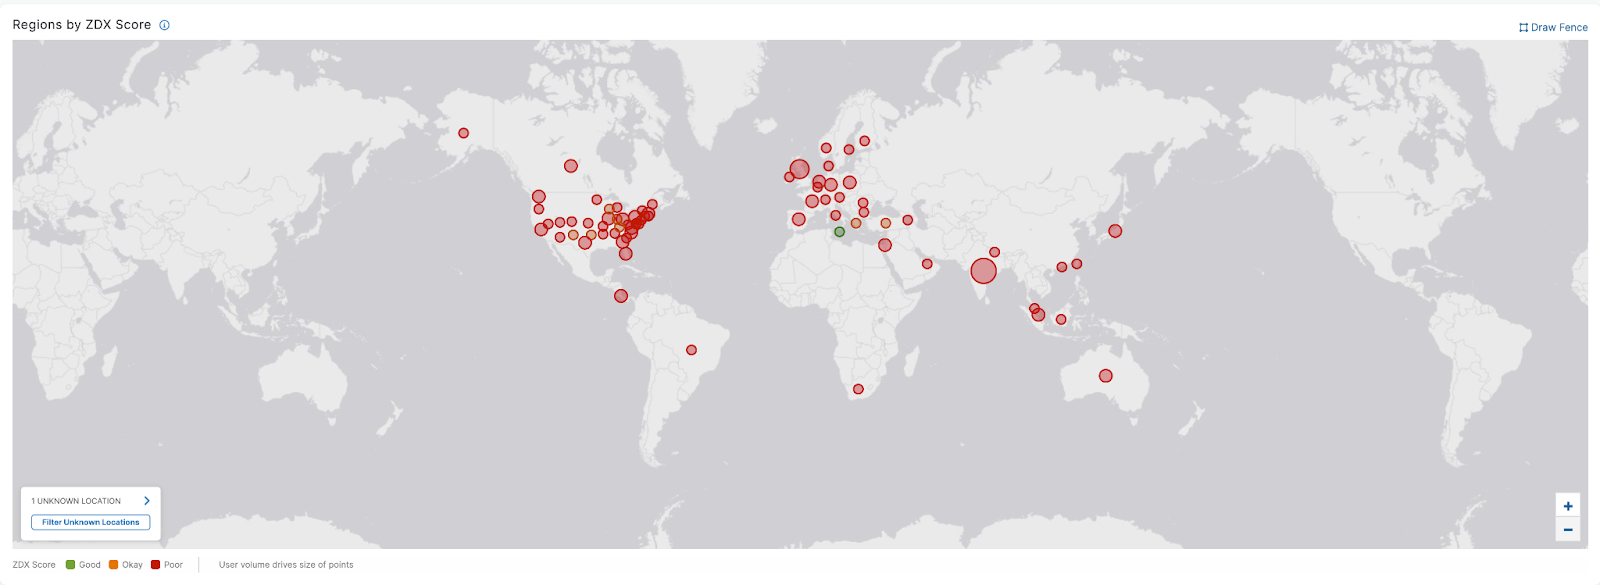
ZDX dashboard indicating widespread LinkedIn outage
ZDX enables customers to proactively identify and quickly isolate service issues, giving IT teams confidence in the root cause, reducing mean time to resolve (MTTR) and first response time (MTTD).
ZDX dashboard showing LinkedIn global issues
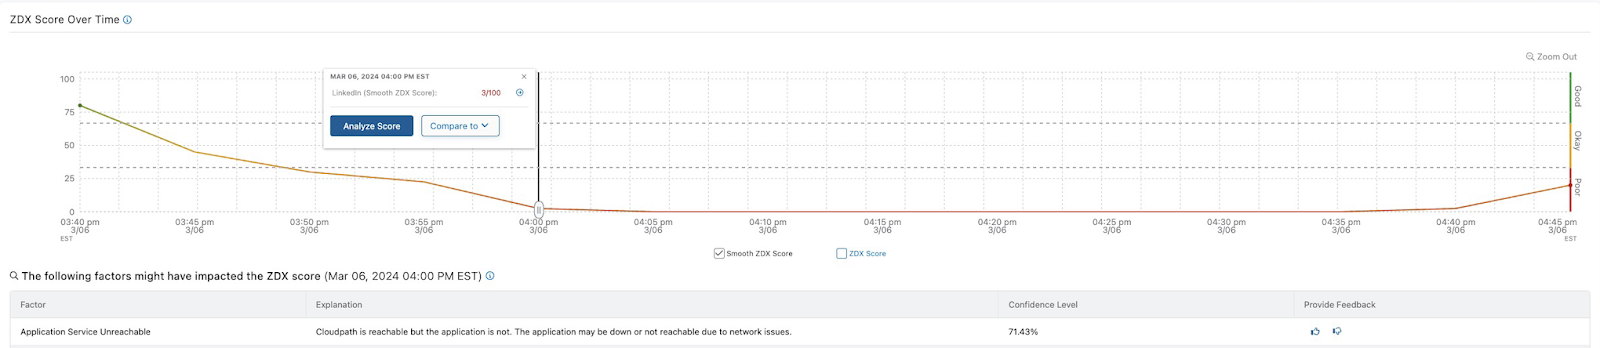
ZDX Score highlights LinkedIn outage
Visible on the ZDX admin portal dashboard, the ZDX Score represents all users in an organization across all applications, locations, and cities on a scale of 0 to 100, with the low end indicating a poor user experience. Depending on the time period and filters selected in the dashboard, the score will adjust accordingly.
The dashboard shows that the ZDX Score for the LinkedIn probes dropped to ZERO during the outage window of approximately 1 hour. From within ZDX, service desk teams can easily see that the service degradation isn’t limited to a single location or user and quickly begin analyzing the root cause.
ZDX Score indicating LinkedIn outage and recovery (times in EST)
Also in the ZDX dashboard, “Web Probe Metrics” highlight the user impact of reaching LinkedIn applications across a timeline with response times. In this case, the server responded with 503 errors, indicating the server was not ready to handle requests.
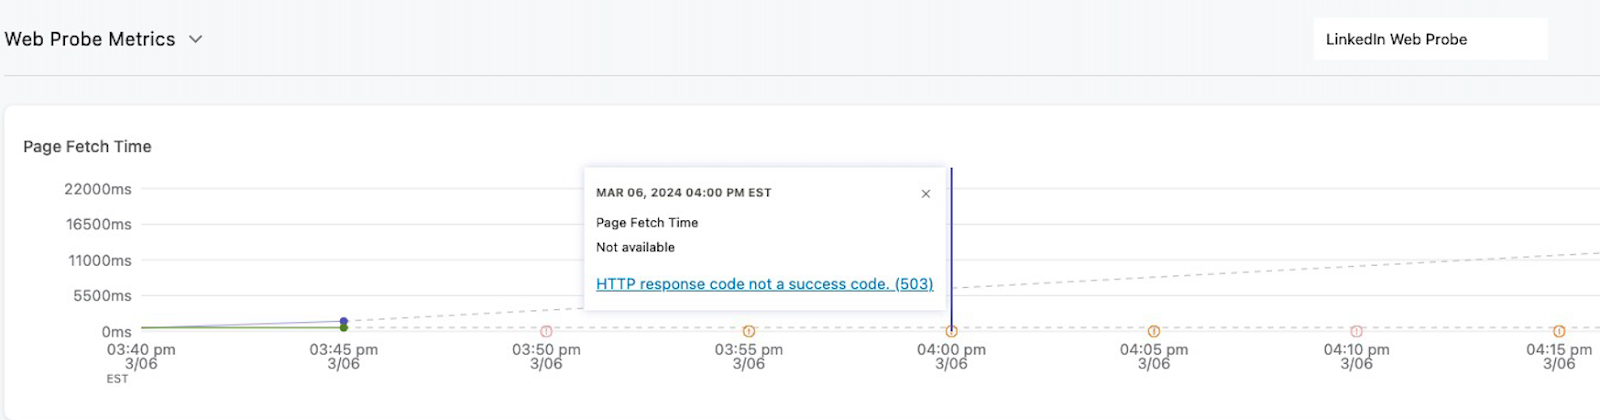
ZDX Web Probe Metrics indicating 503 errors (times in EST)
ZDX can quickly identify the root cause of user experience issues with its new AI-powered root cause analysis capability. This spares IT teams the labor of sifting through fragmented data and troubleshooting, thereby accelerating resolution and keeping employees productive.
With a simple click in the ZDX dashboard, you can analyze a score, and ZDX will provide insight into potential issues. As you can see, in the case of this LinkedIn outage, ZDX highlights that the application is impacted while the network itself is fine.

ZDX AI-powered root cause analysis indicates the reason for the outage
When there’s an application outage, many IT teams turn to the network as the root cause. However, as you can see above, ZDX AI-powered root cause analysis verified that the network transport wasn’t the issue; it was actually at the application level. You can verify this by looking at the CloudPath metrics from the user to the destination.
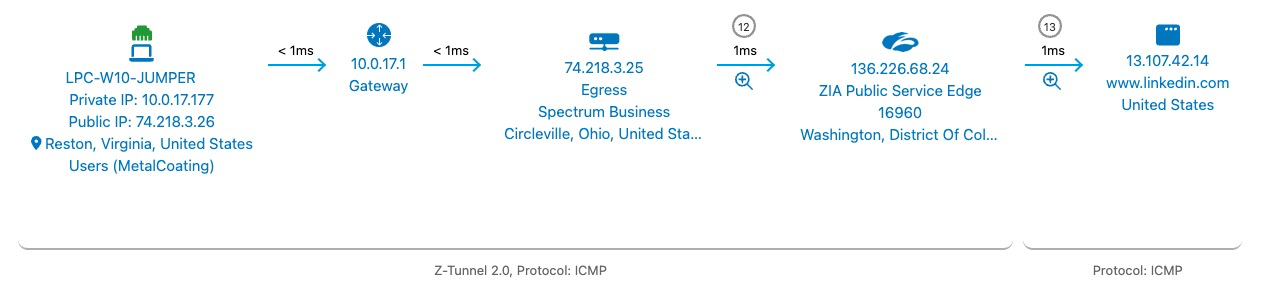
ZDX CloudPath showing full end-to-end data path
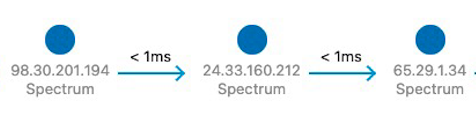
ZDX CloudPath detailed hops between the nodes
With AI-powered analysis and dynamic alerts, IT teams can quickly compare optimal vs. degraded user experiences and set intelligent alerts based on deviations in observed metrics. ZDX allows you to compare two points in time to understand the differences between them. This function determines a good vs. poor user experience, visually highlighting the differences between application, network, and device metrics.
The end user comparison during the LinkedIn outage vs. a known good score indicates the ZDX Score difference, highlighting the unexpected performance drop for the end user.
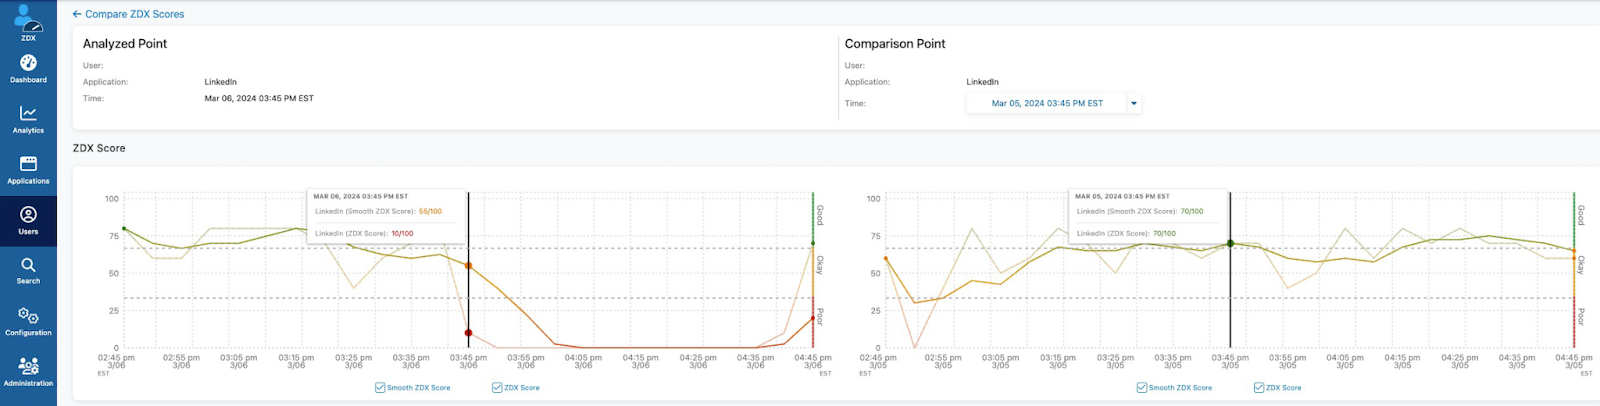
ZDX comparison mode identifies the change in user experience
According to the LinkedIn status page, the outage was reported at 12:50 PST until 14:05 PST, which correlates to the ZDX data above. However, LinkedIn services started to recover pretty quickly, by 13:40 PST, and LinkedIn reported the issue resolved by 14:05 PST.
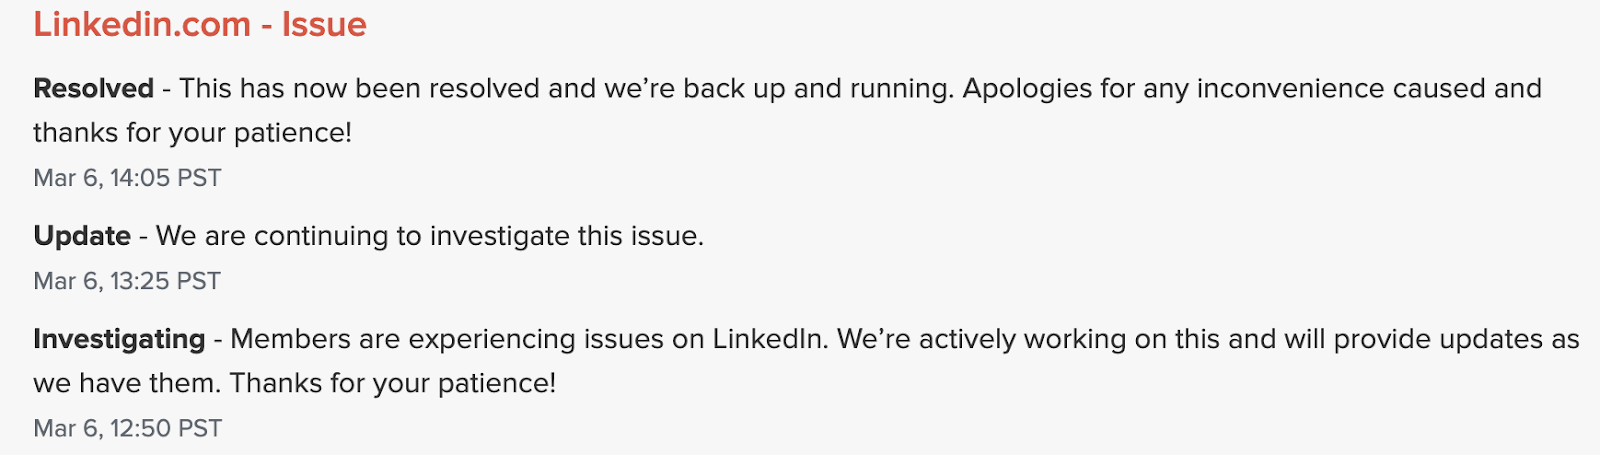
Source: LinkedIn
With ZDX alerting, our customers were proactively notified about end user problems, and incidents were opened automatically with our service desk integration (e.g., ServiceNow) long before users started to report it. From a single dashboard, customers were able to quickly identify this as a LinkedIn issue, not an internal network outage, saving precious IT time.
Zscaler Digital Experience successfully detected a LinkedIn outage along with its root cause, giving our customers the confidence that it was not a single location, their networks, or devices, averting critical impact to their business.
Try Zscaler Digital Experience today
ZDX helps IT teams monitor digital experiences from the end user perspective to optimize performance and rapidly fix offending application, network, and device issues. To see how ZDX can help your organization, please contact us.

Was this post useful?
Disclaimer: This blog post has been created by Zscaler for informational purposes only and is provided "as is" without any guarantees of accuracy, completeness or reliability. Zscaler assumes no responsibility for any errors or omissions or for any actions taken based on the information provided. Any third-party websites or resources linked in this blog post are provided for convenience only, and Zscaler is not responsible for their content or practices. All content is subject to change without notice. By accessing this blog, you agree to these terms and acknowledge your sole responsibility to verify and use the information as appropriate for your needs.


Get the latest Zscaler blog updates in your inbox
By submitting the form, you are agreeing to our privacy policy.