Zscaler Blog
Erhalten Sie die neuesten Zscaler Blog-Updates in Ihrem Posteingang
Abonnieren
My Cloud Connector Monitoring Stack - AWS (Part 1)

Sometimes the best ideas start with a simple “what if”. Over the years, I’ve had countless conversations with customers around how to monitor and alert on Zscaler Cloud Connectors – especially in cloud-native environments. So one night, I challenged myself: could I build a fully cloud-native monitoring stack using just the native tools from AWS, Azure, and GCP?
Spoiler: I could
This blog is Part 1 of that journey, focused entirely on what the outcome looks like – a CloudWatch dashboard with key metrics, visualizations, and alerts I’d want to see in production. Think of it as a preview of what’s possible if you’re running Zscaler Cloud Connectors in AWS with Auto Scaling Groups and Gateway Load Balancer
While it’s not an official Zscaler solution (or supported by our team), I hope this sparks ideas for your own deployments. And if you’re wondering how to build it – don’t worry, Part 2 will dive into the full configuration, metrics, thresholds, and a CloudFormation template so you can try it out yourself
Of course, Zscaler already offers native integrations with Nanolog Streaming Service (NSS) to stream Cloud Connector Events and Metrics logs to your on-premise or cloud SIEM – I’ll include some links to the official help portal for that below, but this project is all about cloud-native monitoring!
Nanolog Streaming Service (NSS)
Before we get into this project, please know that Zscaler officially has the ability to stream Cloud Connector Events and Metrics using NSS to your existing SIEM. The key metrics are included and are cloud-agnostic, so you can actually build a beautiful dashboard and alerts in your own SIEM using this method. Here are a few links in case you weren’t aware of this integration:
Now when it comes to Cloud Connectors specifically, there are two feeds:
- Event Logs. These logs are focused on sending status changes for health checks, Zscaler service edge reachability, etc
- Metrics Logs. These logs are focused on sending Overall CPU, Data Plane CPU, Control Plane CPU, memory, throughput utilization, etc
Now back to the fun stuff...
What To Monitor (and Why)?
Let’s focus on what matters most in Cloud Connector architecture: the Data Plane
Cloud Connectors have both a Control Plane and a Data Plane. While the Control Plane handles configuration sync, log forwarding, and updates, traffic keeps flowing even if it’s down
The real question we want to answer:
Can Cloud Connectors keep processing workload traffic without impacting performance?
That’s the job of the Data Plane. It securely tunnels traffic to the Zscaler Zero Trust Exchange (ZTE)—either ZIA, ZPA, or directly to the Internet—depending on your policy.
If the Data Plane is healthy, your traffic is safe. That’s why this blog centers around monitoring only the metrics tied to traffic flow and tunnel health
Key Metrics I Focused On
Every deployment is different, but here’s what I chose to monitor—and why. These are grouped by Zscaler Location, meaning any number of Connectors behind the same GWLB:
| Metric | Explanation |
|---|---|
| EC2 Health and Availability | Track total Cloud Connectors and their status to quickly identify failures |
| Auto Scaling Group Utilization | Gauge how close you are to max capacity and when scaling might be needed |
| Data Plane CPU Utilization | Critical for understanding throughput. High CPU = nearing traffic limits |
| GWLB Target Group Health Checks | Directly tells you if tunnels are up and traffic is flowing |
| Data Plane Bytes (In/Out) | Visualize how much data is processed through Connectors—optional, but insightful |
| GWLB Bytes Processed | Useful for spotting patterns or changes in workload traffic over time |
| NAT Gateway Bytes (In vs Out) | Helpful for understanding data transfer patterns and potential cost impacts |
| Network Latency (RTT in ms) | Adds a layer of observability for network impact going out to Internet |
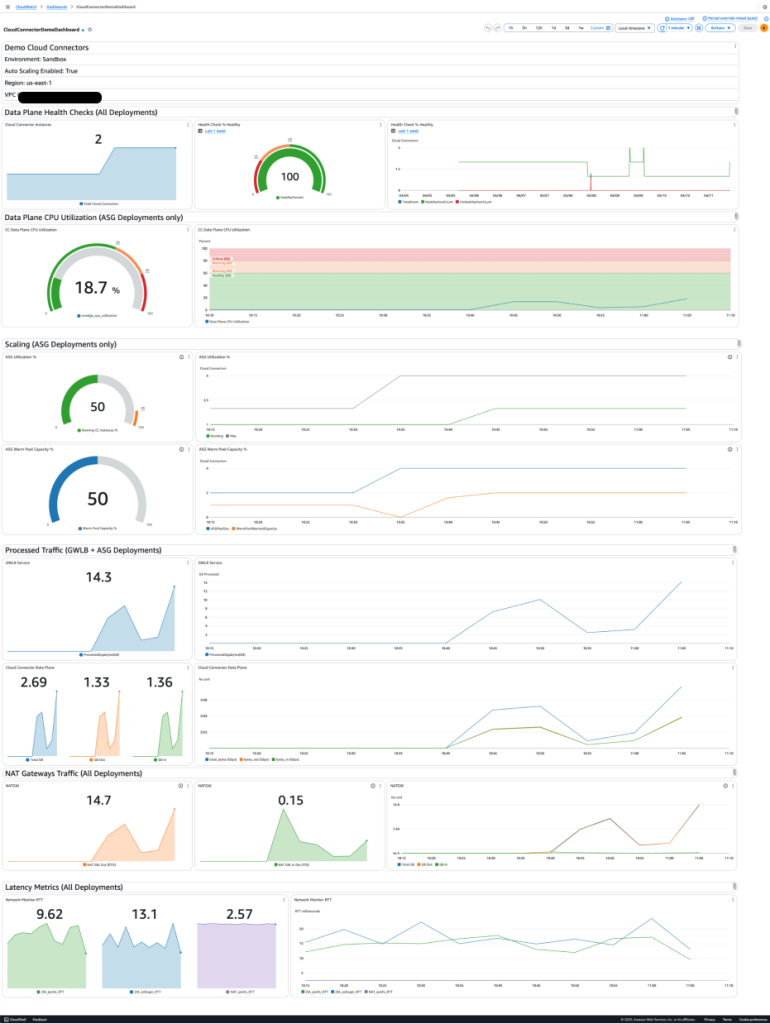
CloudWatch Dashboard
This is what I built in the lab. Everything is visualized in a single CloudWatch dashboard, broken into logical sections:
- Header Text: Highlights region, VPC ID, ASG usage, and environment label
- Text Dividers: Split the dashboard by function (Health, CPU, Scaling, etc.)
- Metric Widgets: Visualize each of the key metrics above using gauges, graphs, and single values
Tip: I used Average over 5-minute periods for most non-network metrics, and Sum for all throughput-related data
As this is my lab environment I need to be transparent and mention this single dashboard is for a single location (aka a set of Cloud Connectors) behind the same GWLB. We don't want metrics aggregated across different sets of Connectors in different Regions as that wouldn't be useful from an operational perspective. However, that can be a useful Executive view if you think that's important! For large deployments would it make sense to create a different dashboard for each set of Cloud Connectors behind the same GWLB? Maybe. This is where tinkering comes in handy!
Dashboard Sections (What & Why)
First thing’s first, create a new CloudWatch Dashboard with the text dividers and then add the widgets
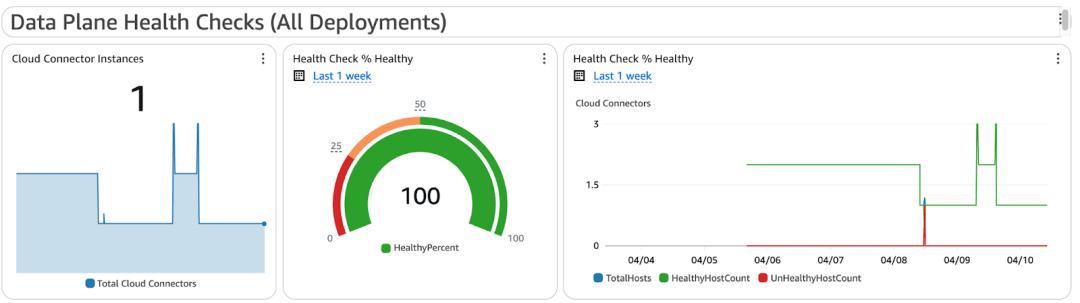
Data Plane Health Checks
Shows the percent of healthy Cloud Connectors behind the GWLB. If this drops too low, traffic may not be processed reliably
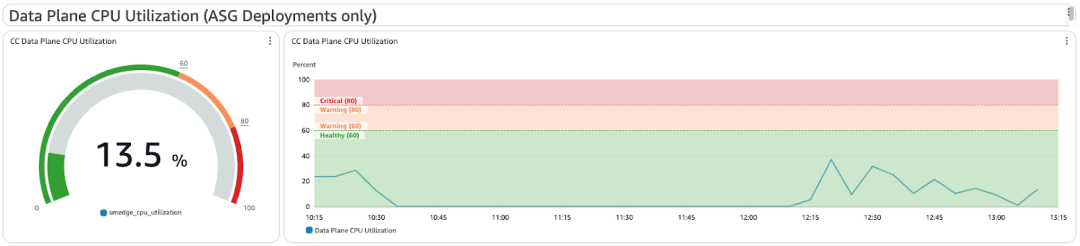
Data Plane CPU Utilization
Custom metric from Zscaler showing CPU load for data processing. Higher values mean you’re nearing traffic limits. Only available with ASG deployments
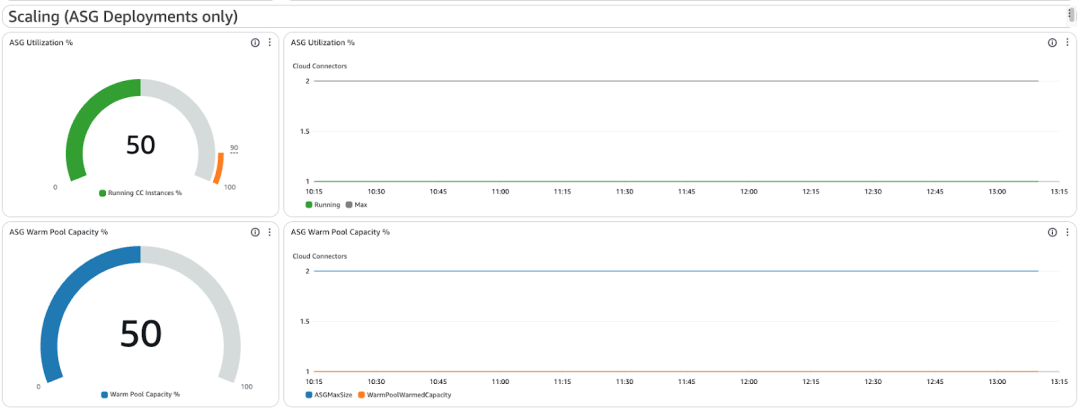
Auto Scaling Utilization
Displays current vs. max instances in the ASG. Useful to see if scaling events are occurring or if you’re hitting configured limits
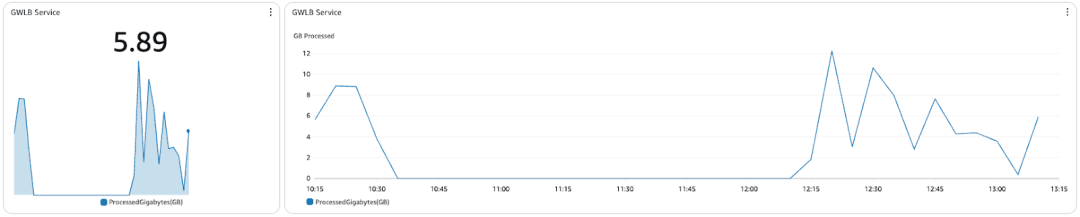
GWLB Service Traffic (Processed Bytes)
Shows how much data the GWLB has processed in GB. Gives insight into workload throughput patterns over time. You can easily convert this to Gbps if needed
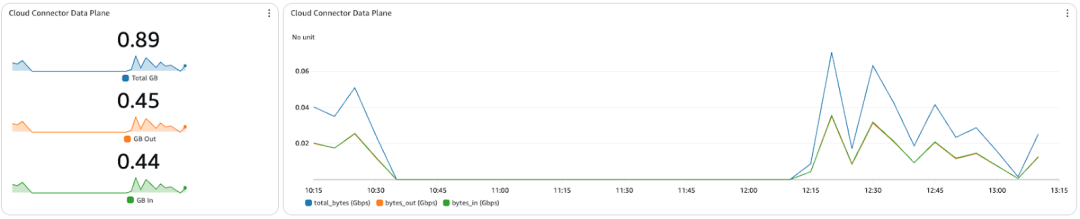
Cloud Connector Data Plane Traffic
Visualizes bytes in/out on the data plane interface of the Cloud Connectors. Good for spotting large uploads/downloads, or verifying traffic is flowing
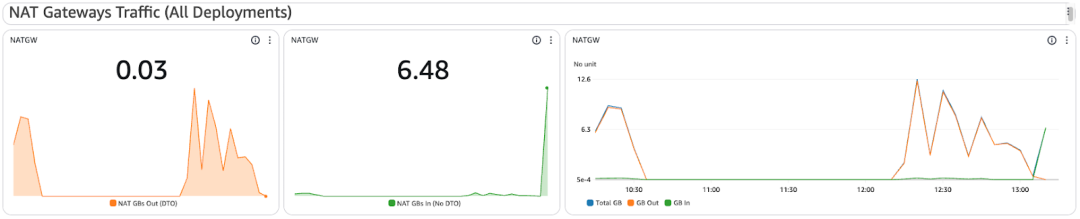
NAT Gateway Utilization
If your Connectors use a NAT Gateway for tunnel egress, this shows bytes in and out. Helpful for understanding data transfer costs (DTO applies only to bytes out)
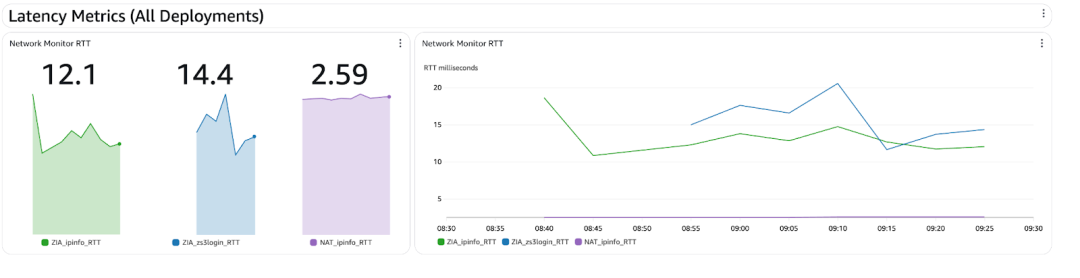
Bonus: Latency Metrics
CloudWatch Network Monitor probes simulate traffic and measure round-trip latency.
- Run one probe through Cloud Connectors (via GWLB) going to the IP of a known public site. I chose to use TCP Port 80 for ipinfo.io
- Run one probe through Cloud Connectors (via GWLB) going to the IP of a Zscaler cloud component. I chose to use TCP Port 80 for login.zscalerthree.net
- Run one probe directly to the Internet (via NAT Gateway) going to the same IP of a known public site to use as a baseline
Get a baseline of the three to detect anomalies or performance issues through the Zscaler or entire AWS path
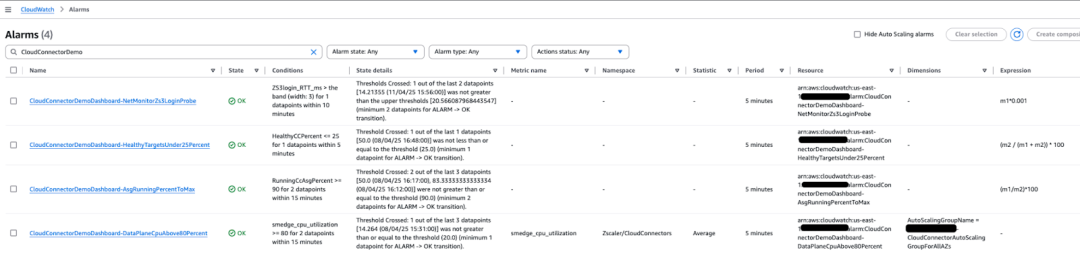
Alerting Strategy
To keep things manageable, I built four key CloudWatch alarms that notify via SNS (email):
| Alarm | What it does |
|---|---|
| Healthy Targets < 25% | Indicates tunnel or instance issues affecting the Data Plane |
| ASG Utilization > 90% | Warns when scaling limits are near and capacity might be maxed |
| Data Plane CPU > 80% | Suggests traffic load may be too high—triggers before packet loss |
| Network Latency (Anomaly) | Detects spikes in RTT beyond a defined baseline—great for spotting Zscaler path issues |
You can customize these thresholds for your environment, but these gave me solid coverage of health, scale, and latency
What’s Next
Everything you’ve seen here – from visualizing data plane health to tracking processed traffic and scaling activity – was built entirely from native AWS (and one Zscaler custom) metrics, and a pinch of CloudWatch magic.
In Part 2, I’ll break down exactly how I built this: the metrics I used, the math behind the expressions, the alarm logic, and of course, a reusable CloudFormation template to get you started
And for those of you running Azure and/or GCP, Parts 3 and 4 are coming soon. Let’s nerd out together!

War dieser Beitrag nützlich?
Weitere Zscaler-Blogs erkunden

Introducing Zscaler Workload Communications Virtual Machine Scale Sets with Microsoft Azure

Granular Control and Flexibility with Cloud Traffic Forwarding

Internet Egress Security Architecture for AWS Workloads | Part 1 - Regional Hubs

Internet Egress Security Architecture for AWS Workloads | Part 2 - Isolated VPCs
Erhalten Sie die neuesten Zscaler Blog-Updates in Ihrem Posteingang
Mit dem Absenden des Formulars stimmen Sie unserer Datenschutzrichtlinie zu.