It's no secret that moving to the cloud can boost productivity and create a happier workforce. Many organizations have already made the switch and are allowing employees to work from anywhere at any time. However, even with these benefits, human error can still occur. At Avanade, we understand this and strive to minimize mistakes as much as possible. While we aren't perfect, we enforce practices that have been successful in the past to protect against errors and attacks. With the ability to proactively identify and fix issues before they pose a risk, we can ensure the safety and productivity of our workforce.
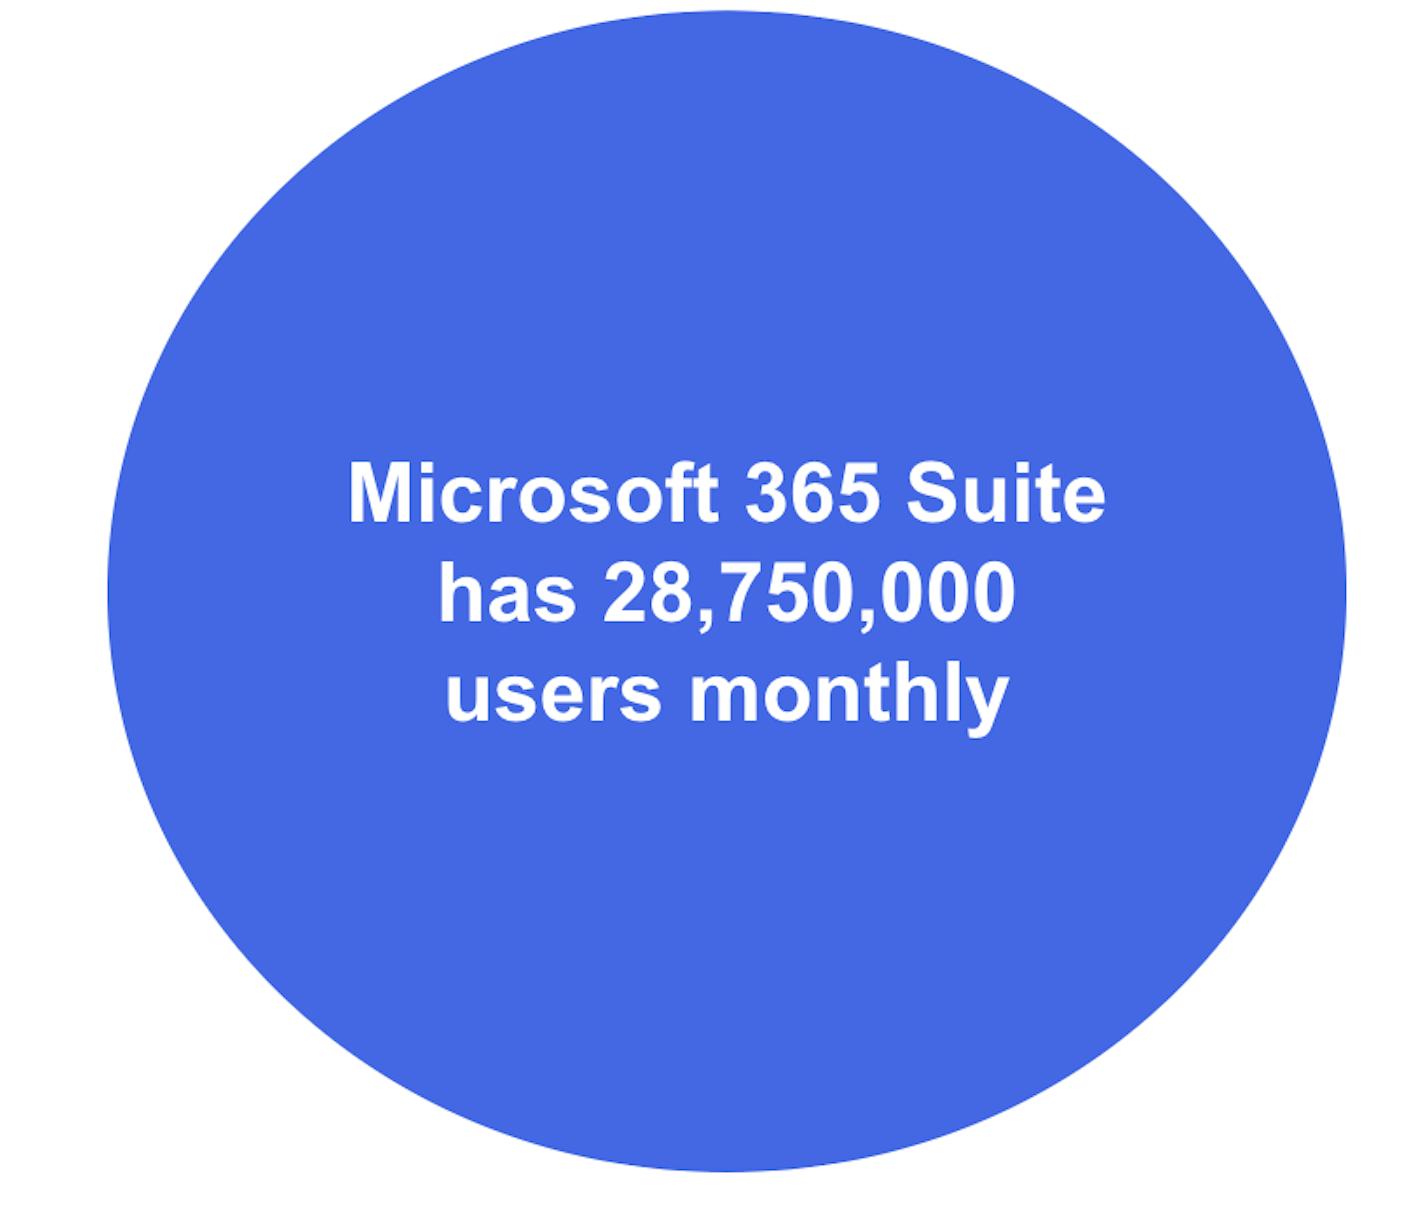
With a lot of us using the cloud, Office 365, or Azure, we know from Signhouse that 49% of organizations are using Microsoft 365, but with any cloud provider, you as an organization need to be proactive, you need to monitor devices, networks, and applications.
If you want to have a happy, enthusiastic, productive, and innovative workforce, it's important to ensure that your systems are operating smoothly and accessible to everyone. One great solution we at Avanade recommend is Zscaler, our trusted partner. In particular we've used Zscaler Digital Experience Monitoring (ZDX) to detect outages across multiple cloud service providers before anyone even reports an issue. It's a great tool that can help you keep your systems running smoothly so your team can focus on what they do best.
ZDX has transformed how the Avanade business operates by providing unrivaled visibility and depth of information for our customers. See below for a detailed description of exactly how ZDX operates and how it can benefit your business, too.
Early detection and proactive notifications
As organizations rely on these cloud-based applications, IT operations must quickly identify if there are any issues with the application. With the internet as the new backbone, it’s challenging to monitor from the endpoint to the application and everything in between. IT operations have gone from managing a network of one, to thousands of networks, and how each device operates in those environments. The question is how to quickly rule out if it’s the device, network, or application to identify the root cause.

Reduce MTTR with full end-to-end visibility
ZDX provides a high-level view from the dashboard with the most impacted applications being monitored. In the following example, Microsoft Outlook is impacted globally, which is highlighted by the red circles on the map. Just by glancing at the map, IT operations teams will know who’s impacted, what regions, and which applications. For example, if the application has issues, it’s important to know who is impacted so IT can proactively communicate with all the impacted users.
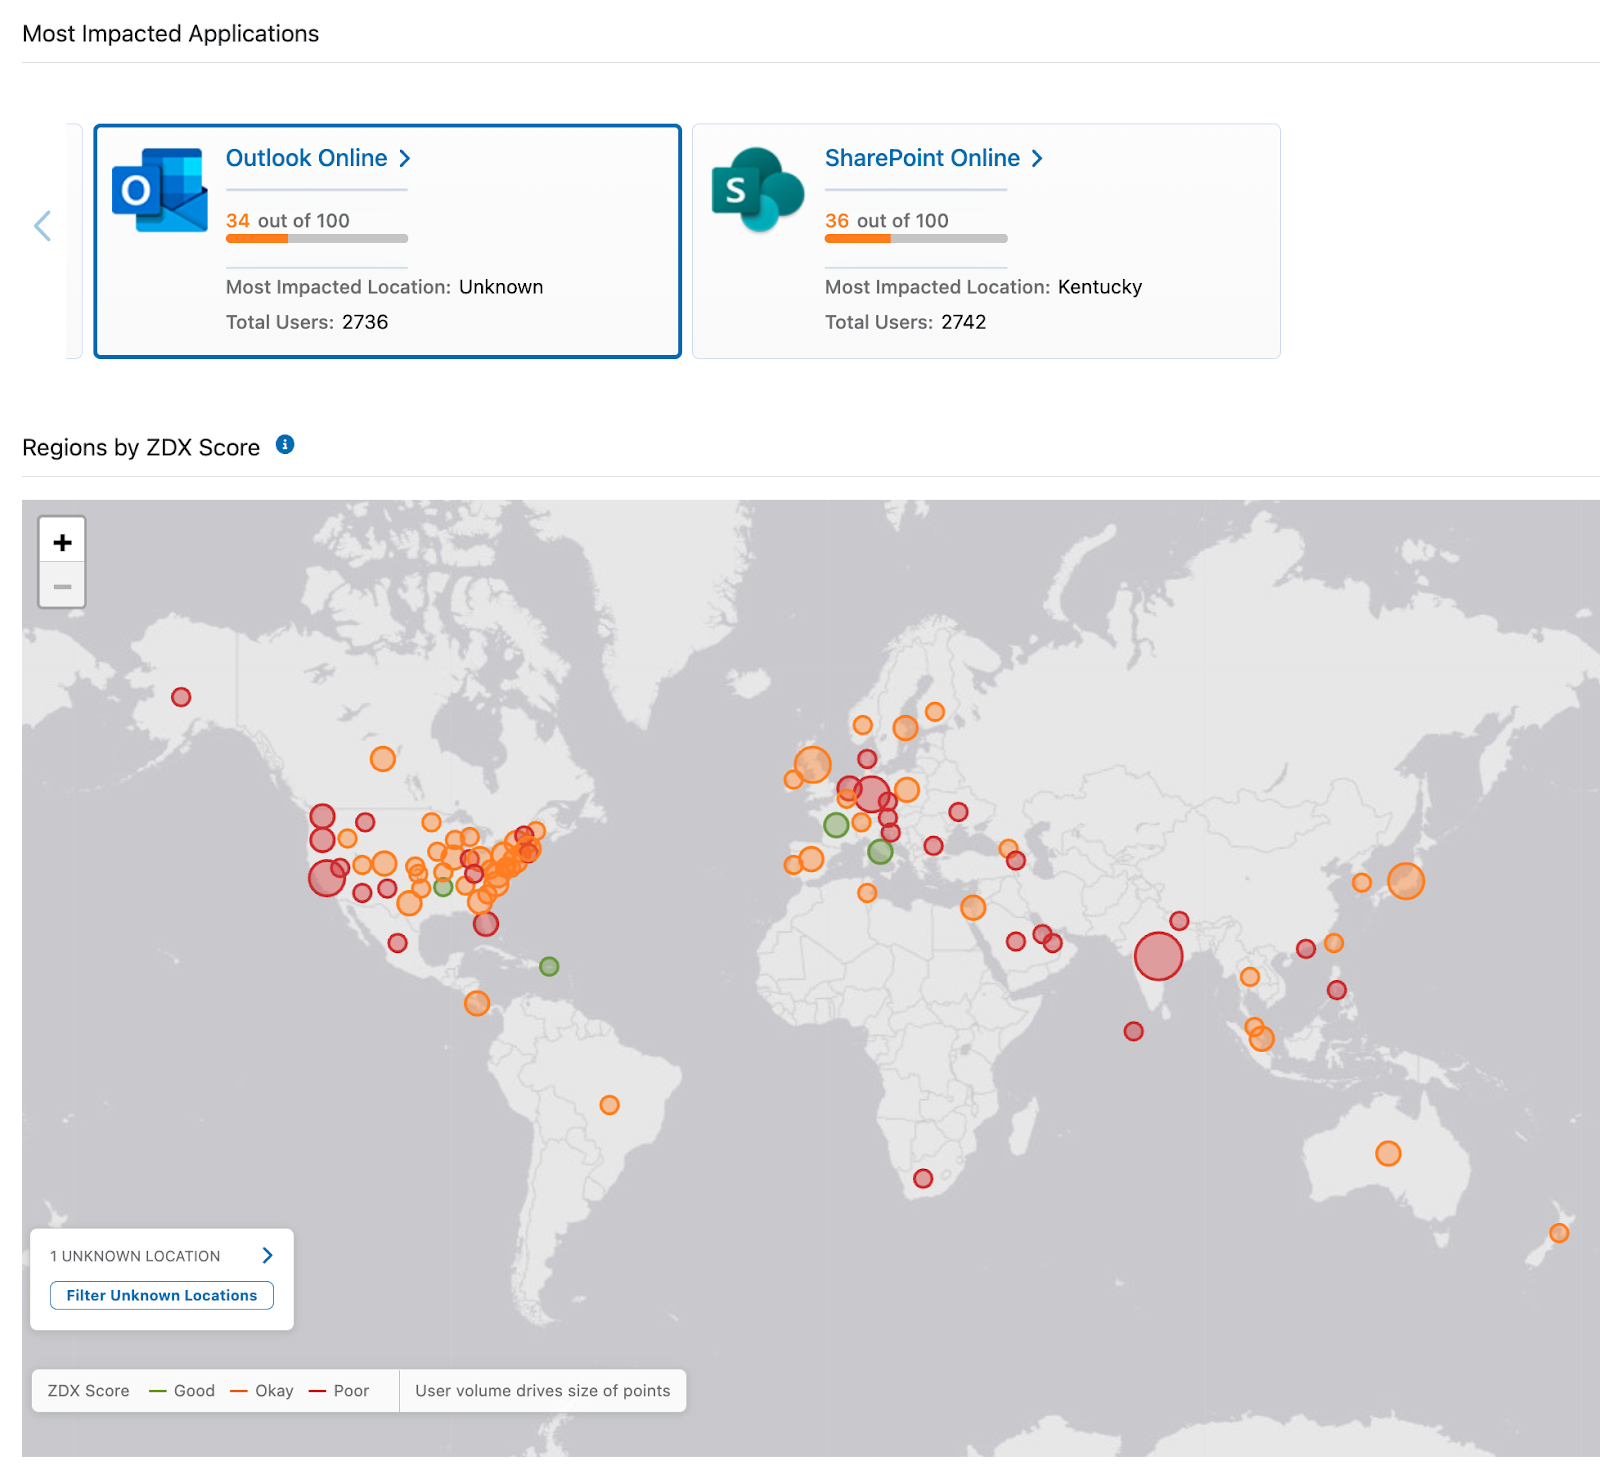
ZDX dashboard highlights applications impacted globally
You can further drill down into the ZDX dashboard and see the ZDX Score, which represents all users in an organization, across all applications, locations, and cities. The ZDX Score is based on a scale of 1 (lowest) to 100 (highest), with the low end indicating a poor user experience.
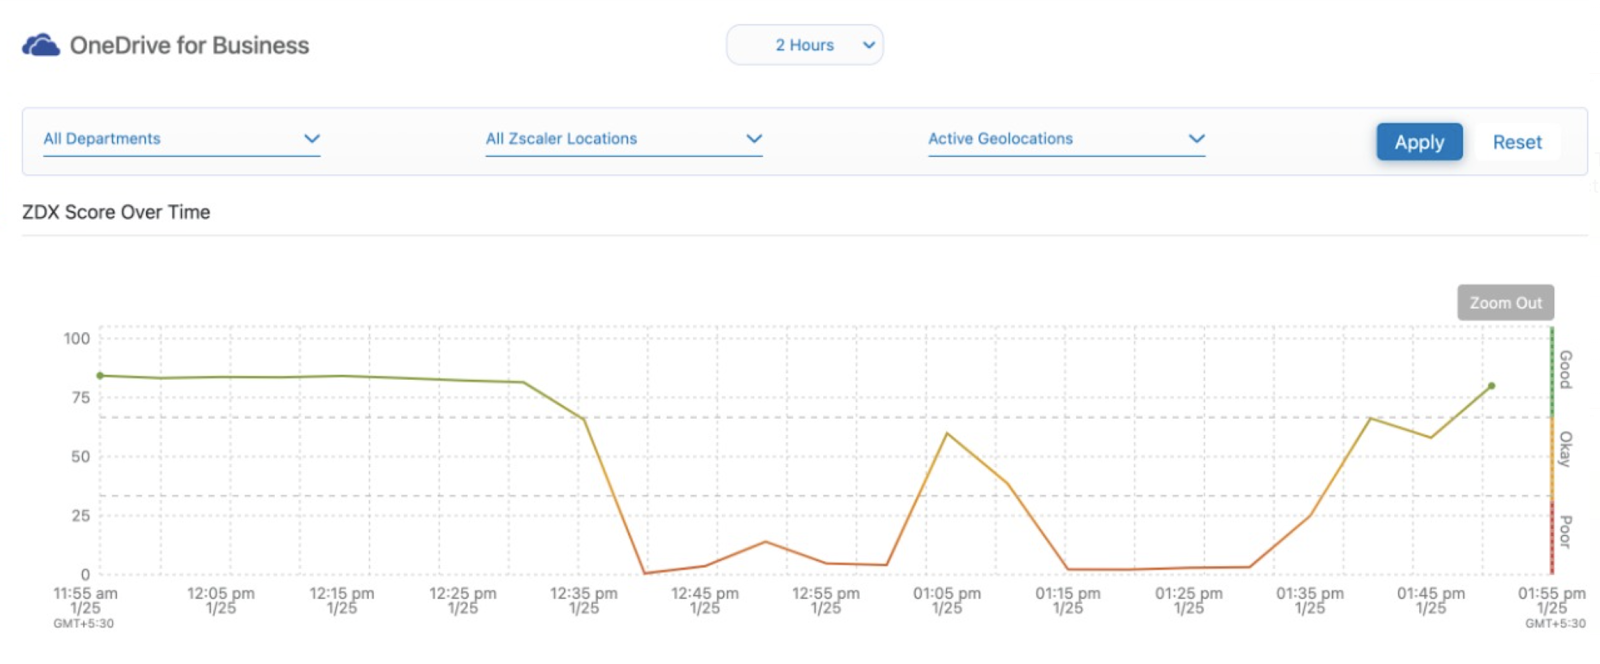
ZDX Score indicating a poor user experience for Microsoft OneDrive
As IT operations look to further triage the issue, they can leverage ZDX to look at the entire path for every user and identify any issues. Below you will find that there is a spike in latency between two of the hops in the network and as you drill into the hops, it’s clear that it’s between two Microsoft Azure routers.

ZDX provides hop-by-hop analysis between the endpoints to the application

ZDX provides detailed information to identify exactly where latencies occur
Armed with this information, IT operations teams can quickly open tickets with Microsoft to get the issue resolved and get users back to work faster. With ZDX, it’s only a matter of a few clicks to get insights into the entire environment.
Supporting the Microsoft 365 Suite is important for collaboration, however, for communications, Microsoft Teams is equally important. One of the most challenging calls IT support can receive is from a user complaining about poor call quality. It’s challenging for many reasons, from isolating the issue to resolving it. With ZDX, Microsoft call quality metrics are pulled into the dashboard to help support teams troubleshoot if the issue is with the entire call, or maybe a single user. You can also get the mean opinion score (MOS) which is a numerical measure of the human-judged overall quality of voice and video during the session.
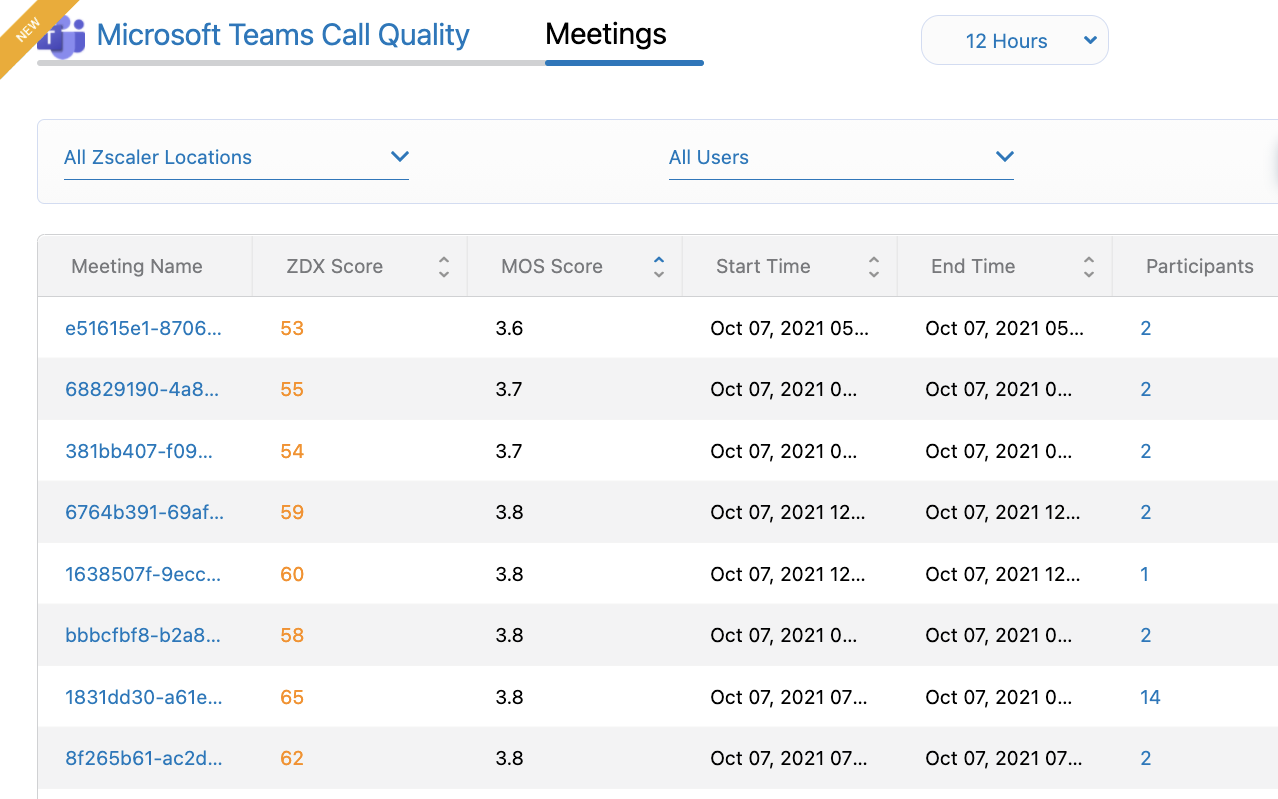
ZDX dashboard highlights Microsoft Teams call quality details
With this information, you can identify which users are having issues and dive deep into their entire path from the device to the application to find the root cause. ZDX provides quick, granular information that IT support can act upon to improve the user experience and ensure a happy, productive workforce.
Granular analytics to accelerate mean time to resolution
ZDX helps network operations teams discover network issues and empowers service teams to quickly diagnose device issues for remote workers no matter where they are located. ZDX offers a range of key metrics including device health and active processes, OS metrics that are critical to troubleshooting device issues. ZDX integrates with Microsoft Endpoint Analytics to identify issues with user software or devices that might impact performance. Metrics are pulled from the Microsoft Intune API and mapped to the individual ZDX users and devices to provide Endpoint Analytics scores and data. So, the next time a user opens up a ticket and complains about their Windows device running into issues, you can easily dive into the dashboard to check the overall health. Watch this video to see it in action!
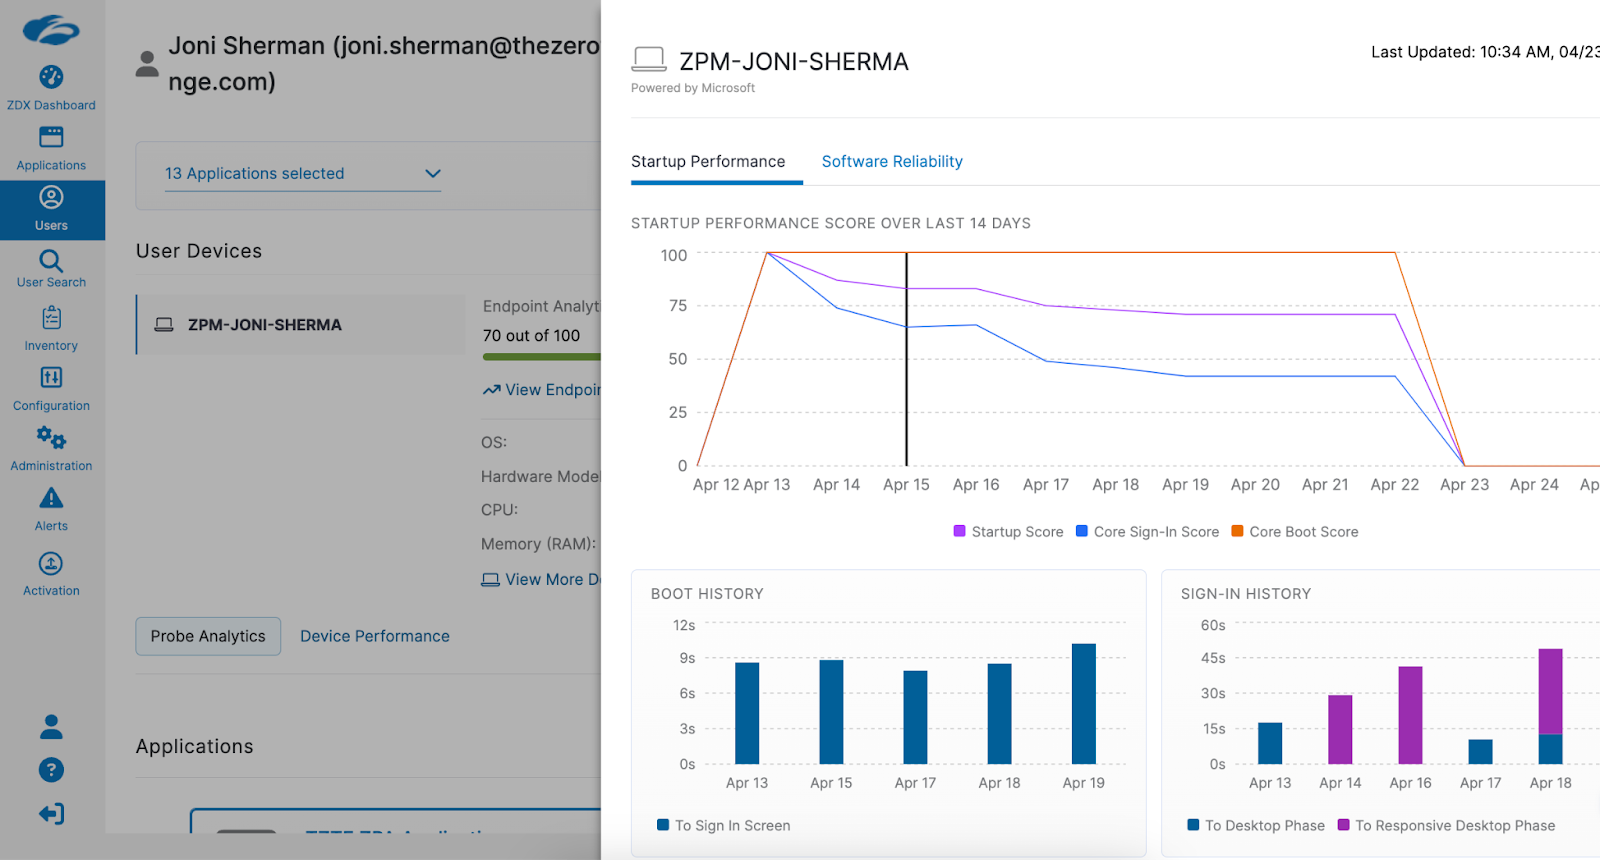
ZDX integrates with Microsoft Intune to reduce troubleshooting time
There are times when users run into slow device issues, and it’s not always clear to them what’s causing the issue. With ZDX, you can quickly pinpoint the top processes, which are consuming the device CPU, memory, disk IO, and network IO to identify what is causing it. Service desk teams can use this information to have the end user stop the application to get them back to work. Watch this video to see it in action!
One of the key features that stands out is the ability to proactively identify issues before they become major problems. This has proven to be a game-changer for our customers, as it has helped them to quickly address issues that may have been lingering for years, or to address more recent issues that could have a major impact on user experience. By having this lead time, users can be informed and infrastructure changes can be made as needed, such as switching front door locations. This has allowed customers to maintain a seamless user experience, even in the face of downtime in specific locations, all while minimizing any potential impact to performance.
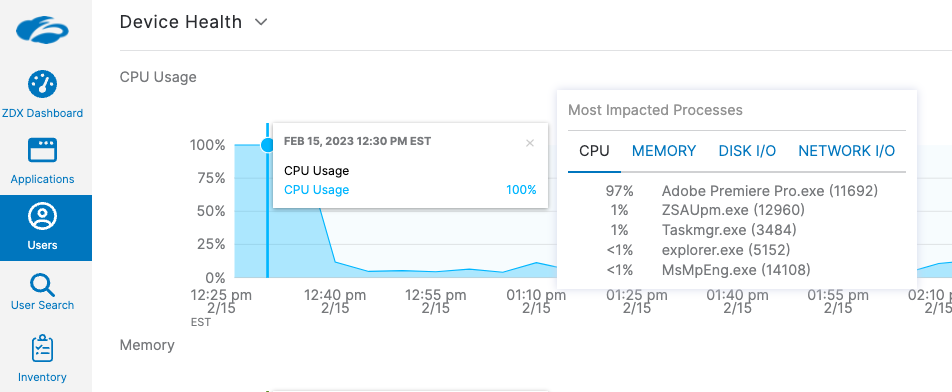
ZDX indicates the top process impacting device performance
Achieve faster resolutions using AI
Oftentimes, end users are in a rush to either get on a call or connect to a public cloud app (e.g., OneDrive), and don’t have time to wait for a typical diagnosis. Standard runbooks are cumbersome and frustrate the end user. To quickly identify the root cause of an end user’s issue across the device, networks, or applications, ZDX leverages machine learning and artificial intelligence to pinpoint the root of an issue. This spares IT teams the labor of sifting through fragmented data and troubleshooting, thereby accelerating resolution and keeping employees productive. With AI-powered automated root cause analysis, in a few clicks, service desk teams can quickly identify the issue and take the necessary steps to resolve it. Watch this video to see it in action!
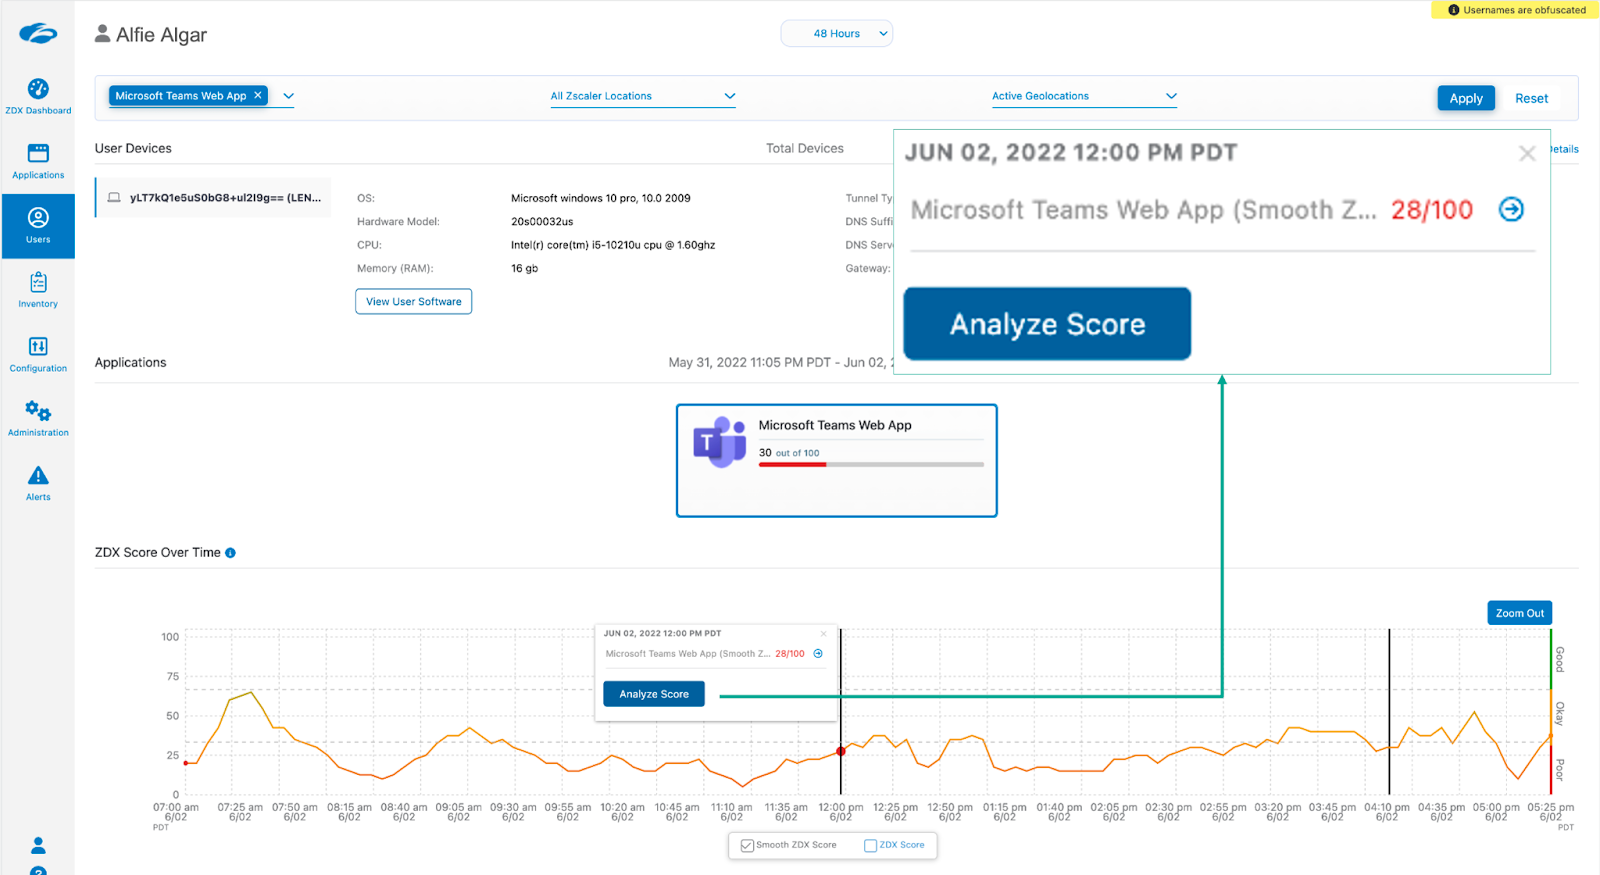
ZDX AI-powered root causes analysis
Get started today
As organizations look to support the millions of Microsoft Suite users, it’s important to think about driving increased end user productivity while reducing overall costs. ZDX helps organizations ensure a great user experience across devices, networks, and applications. Follow us on Twitter @zscaler for the latest news on network outages. We publish what we see and oftentimes are able to provide you with information on outages before they are known. If you want to learn more about ZDX, click here.
We know digital transformation can feel overwhelming at times. Zscaler and Avanade are here to help answer any questions you may have about getting started, deployment details, and how it can address the specific needs of your organization.


